Third Quarter 2023 Financial Results
THIRD QUARTER FINANCIAL RESULTS
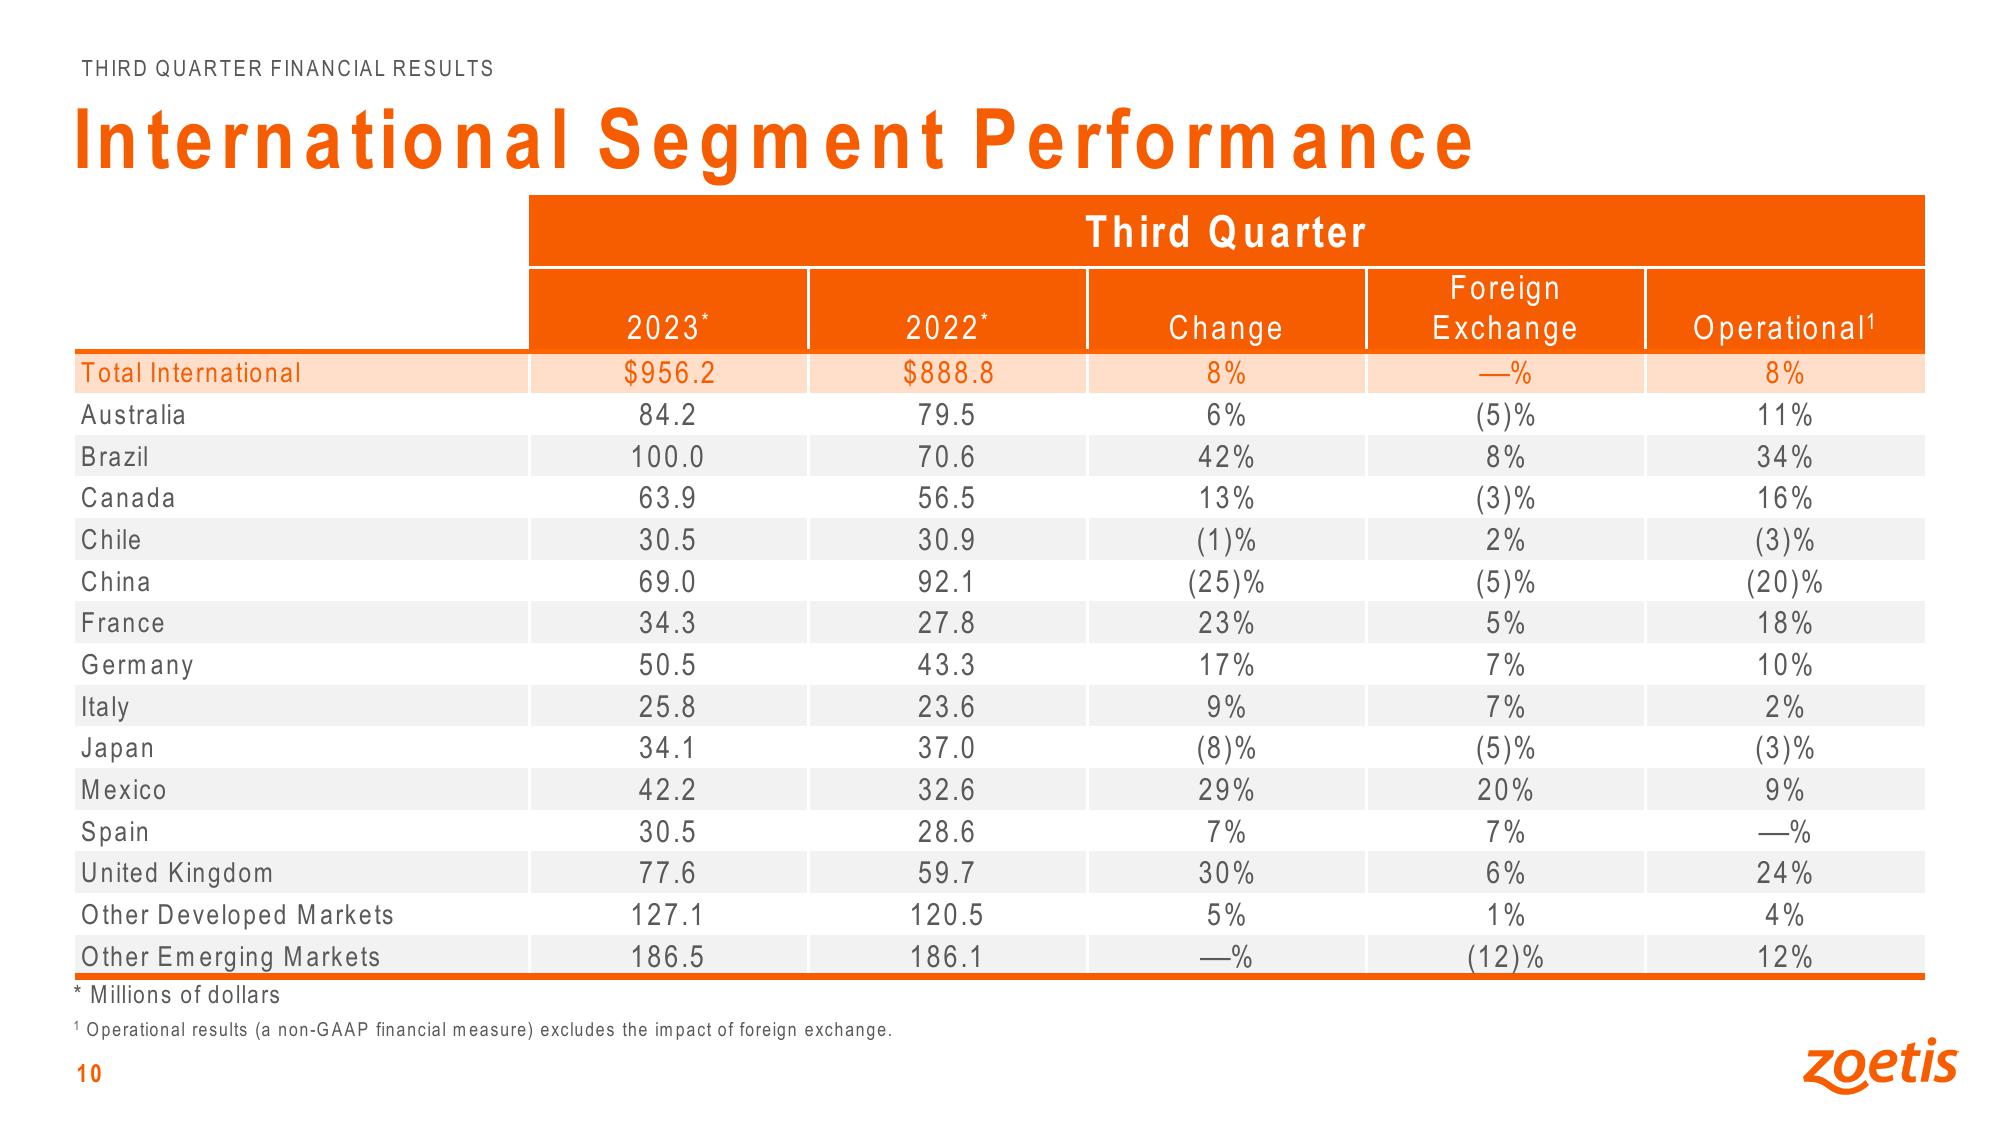
International Segment Performance
Third Quarter
Total International
Australia
Brazil
Canada
Chile
China
France
Germany
Italy
Japan
Mexico
Spain
United Kingd
2023*
$956.2
84.2
100.0
63.9
30.5
69.0
34.3
50.5
25.8
34.1
42.2
30.5
77.6
127.1
186.5
Other Developed Markets
Other Emerging Markets
* Millions of dollars
1 Operational results (a non-GAAP financial measure) excludes the impact of foreign exchange.
10
2022*
$888.8
79.5
70.6
56.5
30.9
92.1
27.8
43.3
23.6
37.0
32.6
28.6
59.7
120.5
186.1
Change
8%
6%
42%
13%
(1)%
(25)%
23%
17%
9%
(8)%
29%
7%
30%
5%
-%
Foreign
Exchange
—%
(5)%
8%
(3)%
2%
(5)%
5%
7%
7%
(5)%
20%
7%
6%
1%
(12)%
Operational¹
8%
11%
34%
16%
(3)%
(20)%
18%
10%
2%
(3)%
9%
—%
24%
4%
12%
zoetisView entire presentation