Quanergy SPAC Presentation Deck
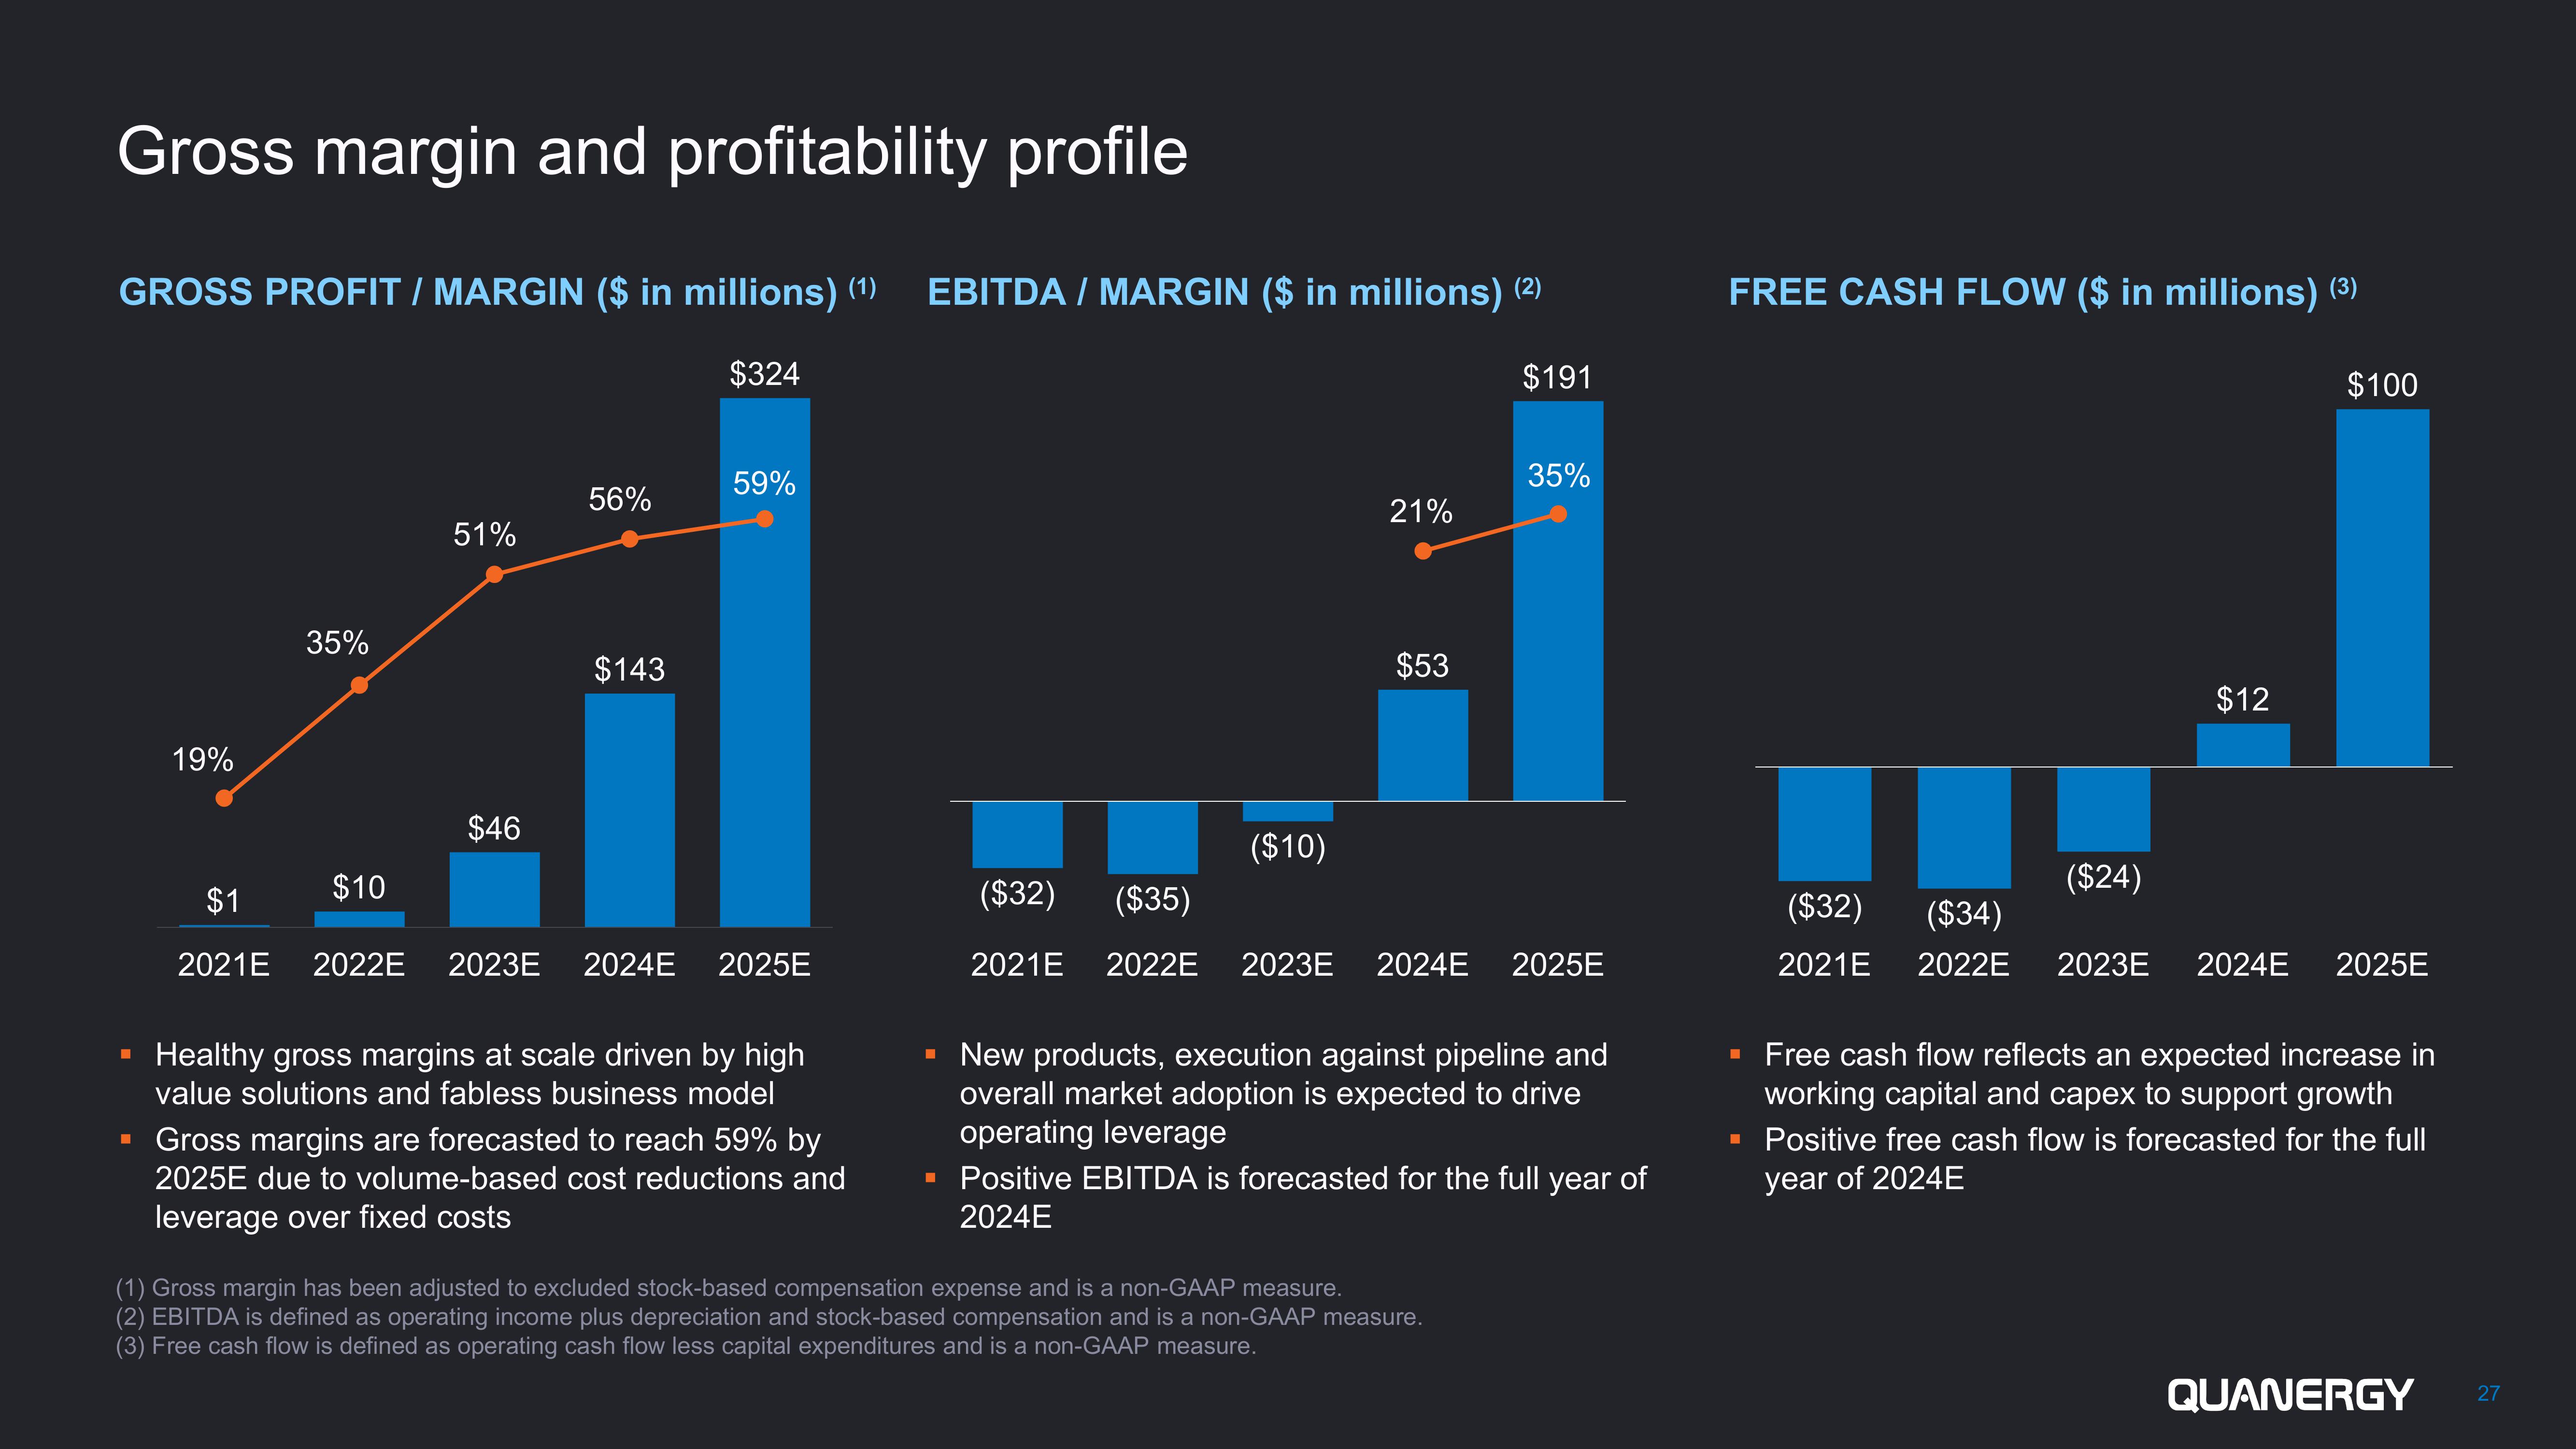
Gross margin and profitability profile
GROSS PROFIT / MARGIN ($ in millions) (1)
$324
19%
35%
51%
$46
56%
$143
59%
$1
$10
2021E 2022E 2023E 2024E 2025E
Healthy gross margins at scale driven by high
value solutions and fabless business model
▪ Gross margins are forecasted to reach 59% by
2025E due to volume-based cost reductions and
leverage over fixed costs
EBITDA / MARGIN ($ in millions) (2)
$191
($10)
21%
$53
35%
($32) ($35)
2021E 2022E 2023E 2024E 2025E
▪ New products, execution against pipeline and
overall market adoption is expected to drive
operating leverage
▪ Positive EBITDA is forecasted for the full year of
2024E
(1) Gross margin has been adjusted to excluded stock-based compensation expense and is a non-GAAP measure.
(2) EBITDA is defined as operating income plus depreciation and stock-based compensation and is a non-GAAP measure.
(3) Free cash flow is defined as operating cash flow less capital expenditures and is a non-GAAP measure.
FREE CASH FLOW ($ in millions) (³)
■
($24)
$12
$100
($32) ($34)
2021E 2022E 2023E 2024E 2025E
Free cash flow reflects an expected increase in
working capital and capex to support growth
▪ Positive free cash flow is forecasted for the full
year of 2024E
QUANERGY
27View entire presentation