Dutch Bros Results Presentation Deck
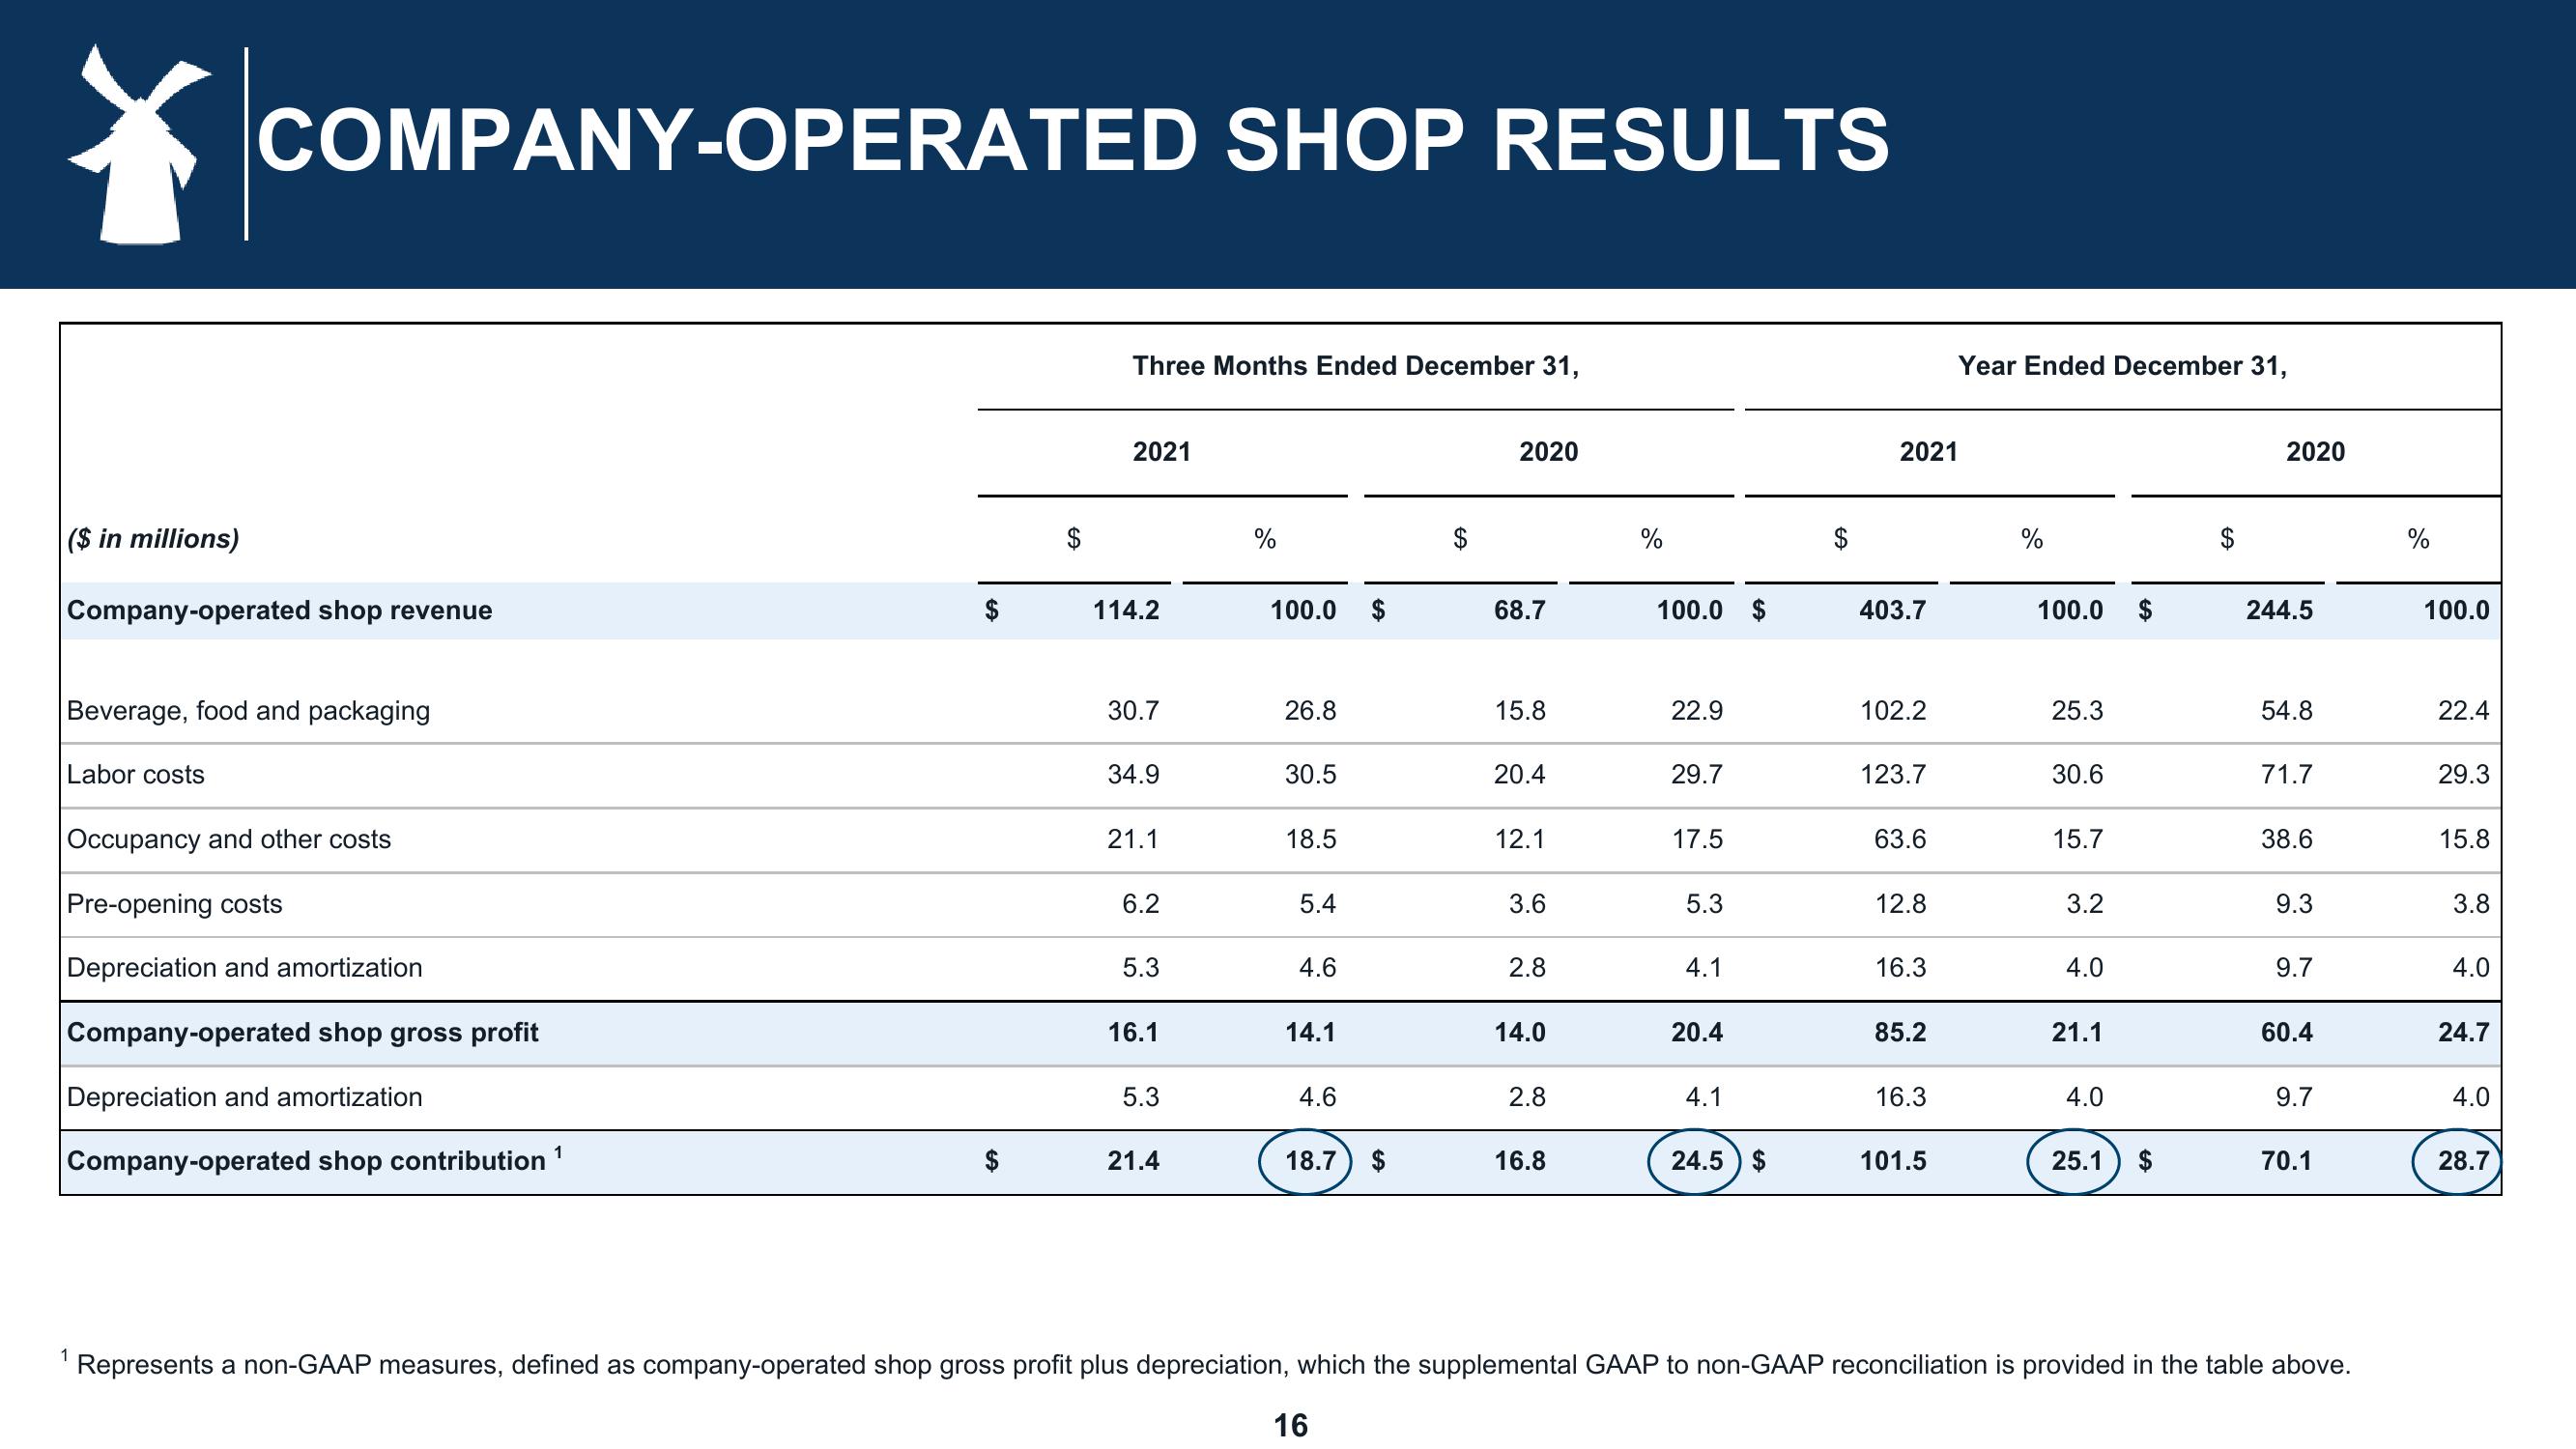
COMPANY-OPERATED SHOP RESULTS
($ in millions)
Company-operated shop revenue
Beverage, food and packaging
Labor costs
Occupancy and other costs
Pre-opening costs
Depreciation and amortization
Company-operated shop gross profit
Depreciation and amortization
Company-operated shop contribution
1
Three Months Ended December 31,
2021
114.2
30.7
34.9
21.1
6.2
5.3
16.1
5.3
21.4
%
100.0
26.8
30.5
18.5
5.4
4.6
14.1
4.6
18.7 $
2020
16
68.7
15.8
20.4
12.1
3.6
2.8
14.0
2.8
16.8
%
100.0 $
22.9
29.7
17.5
5.3
4.1
20.4
4.1
24.5) $
2021
403.7
102.2
123.7
63.6
12.8
16.3
85.2
16.3
101.5
Year Ended December 31,
%
100.0
25.3
30.6
15.7
3.2
4.0
21.1
4.0
25.1 $
FA
2020
244.5
54.8
71.7
38.6
9.3
9.7
60.4
9.7
70.1
1 Represents a non-GAAP measures, defined as company-operated shop gross profit plus depreciation, which the supplemental GAAP to non-GAAP reconciliation is provided in the table above.
%
100.0
22.4
29.3
15.8
3.8
4.0
24.7
4.0
28.7View entire presentation