Pathward Financial Results Presentation Deck
NON-GAAP RECONCILIATION
29
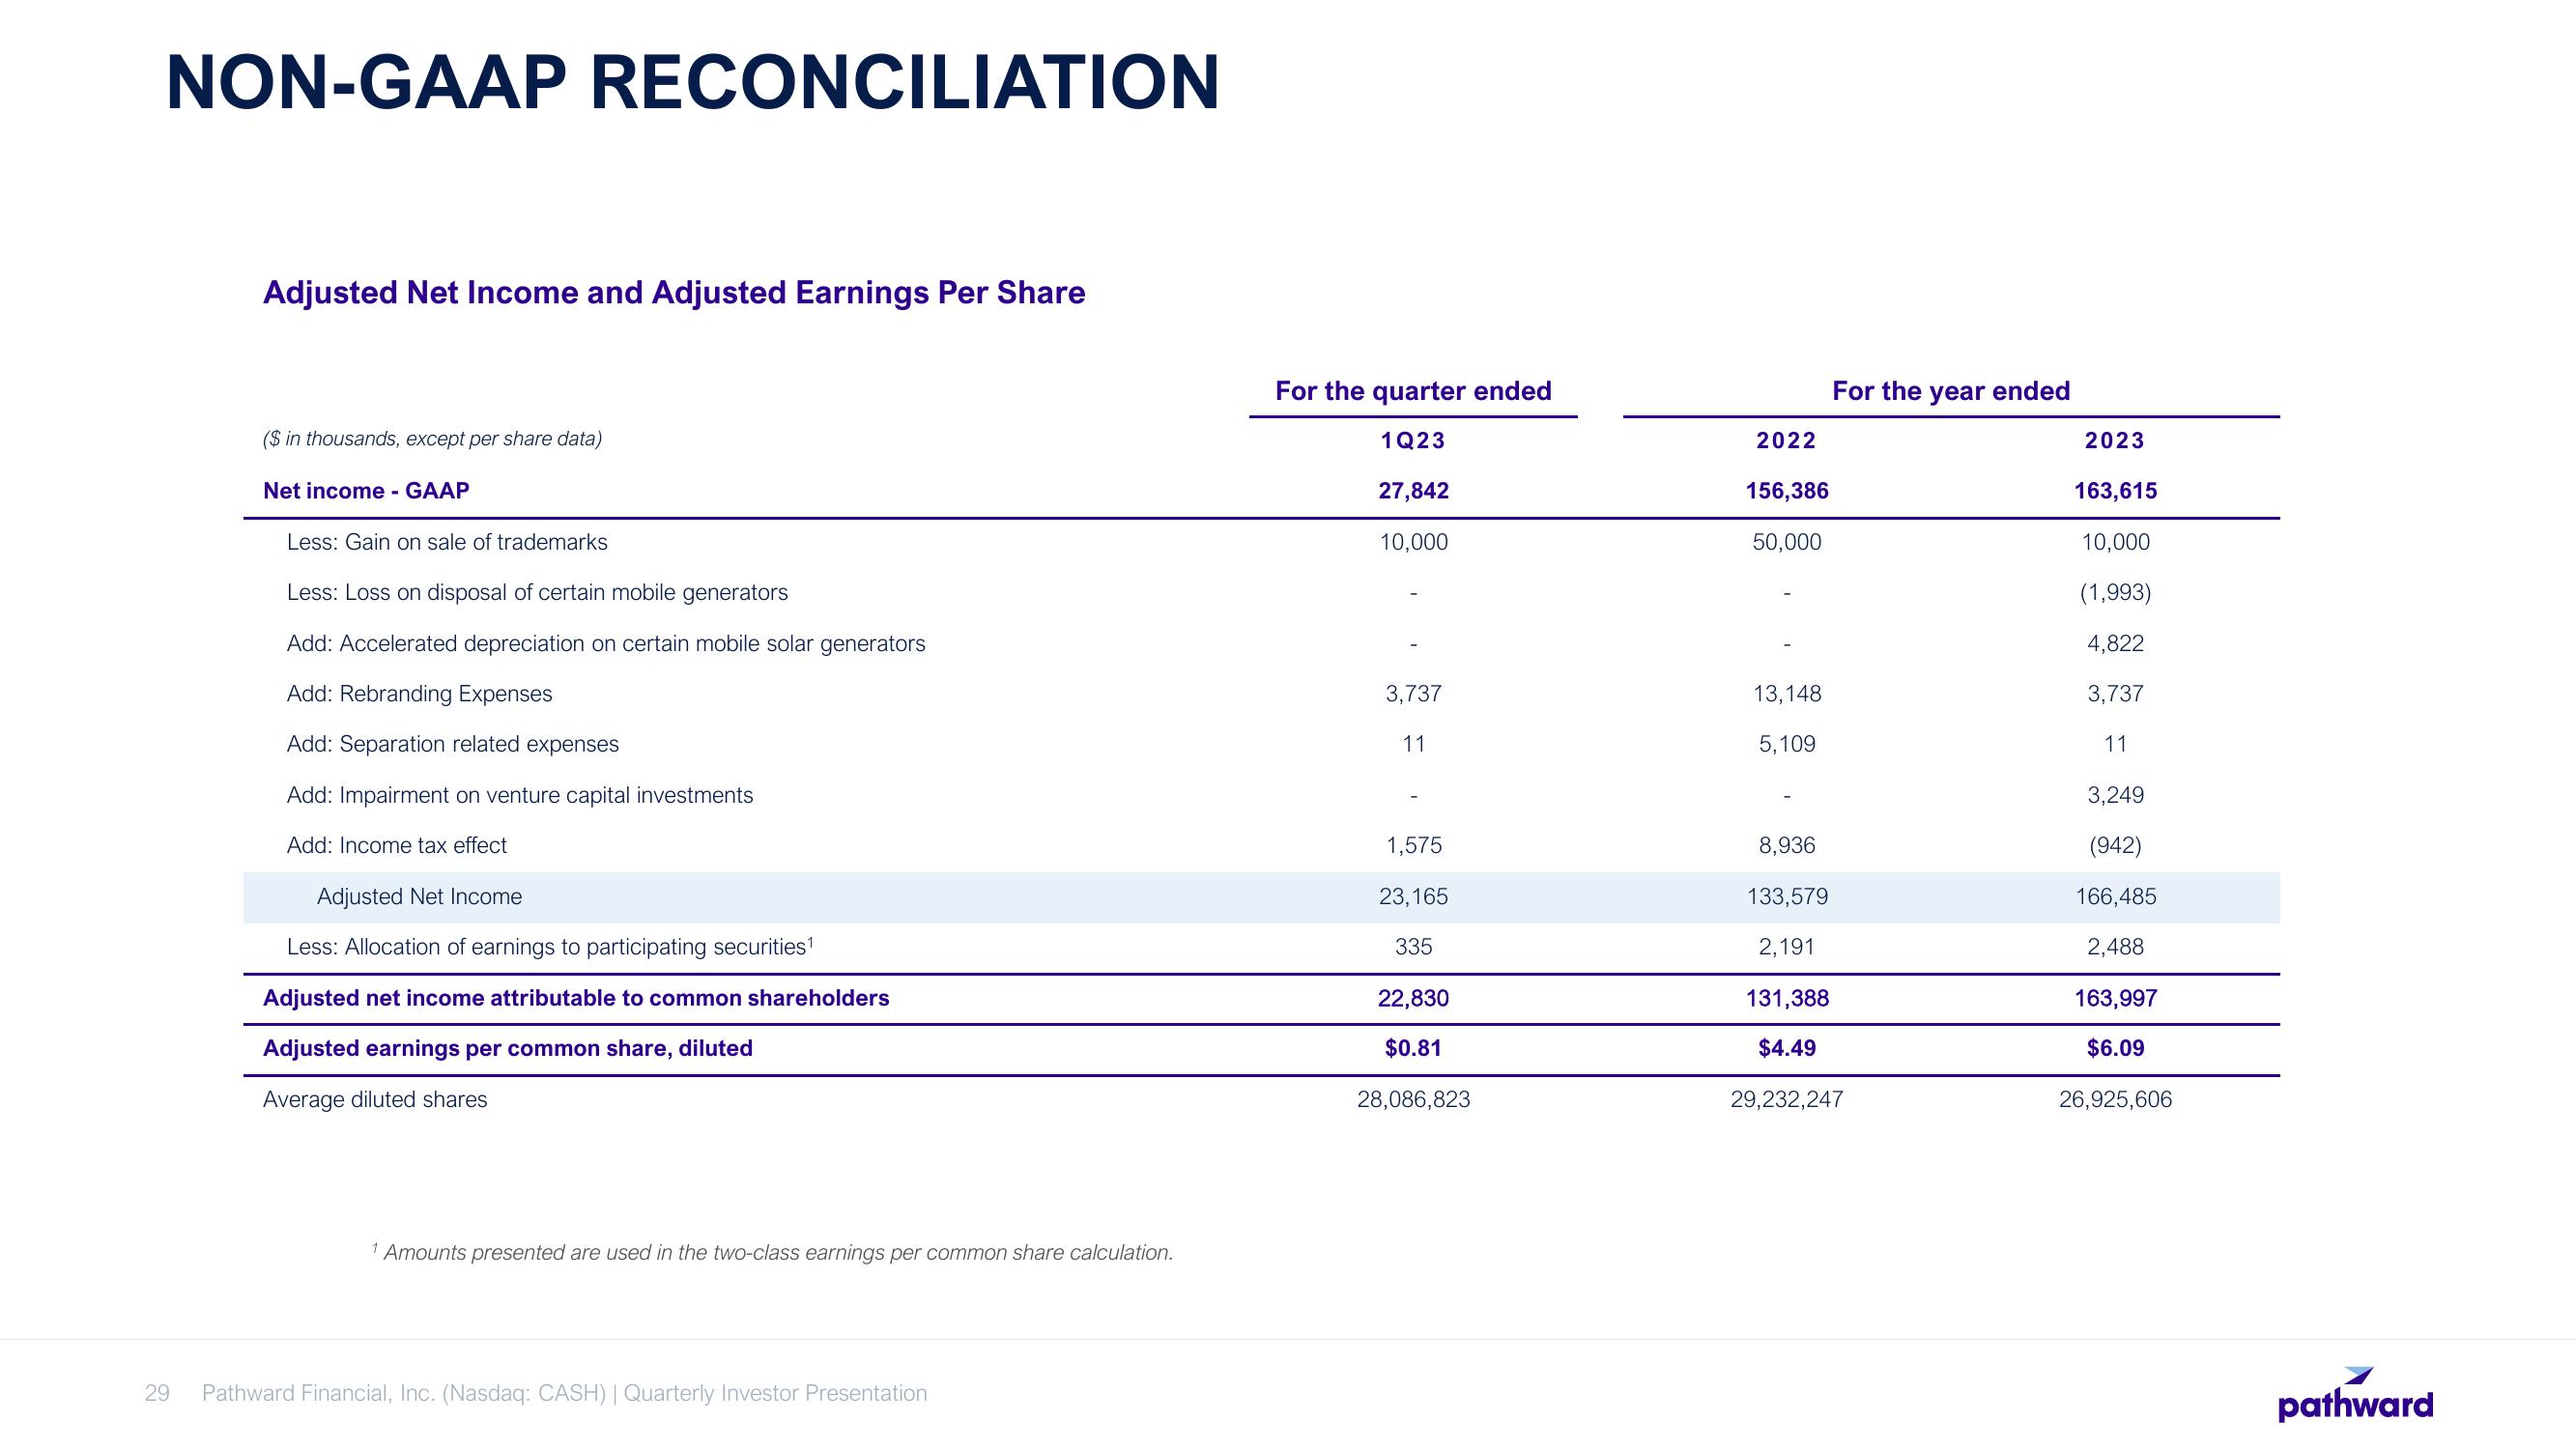
Adjusted Net Income and Adjusted Earnings Per Share
($ in thousands, except per share data)
Net income - GAAP
Less: Gain on sale of trademarks
Less: Loss on disposal of certain mobile generators
Add: Accelerated depreciation on certain mobile solar generators
Add: Rebranding Expenses
Add: Separation related expenses
Add: Impairment on venture capital investments
Add: Income tax effect
Adjusted Net Income
Less: Allocation of earnings to participating securities¹
Adjusted net income attributable to common shareholders
Adjusted earnings per common share, diluted
Average diluted shares
1 Amounts presented are used in the two-class earnings per common share calculation.
Pathward Financial, Inc. (Nasdaq: CASH) | Quarterly Investor Presentation
For the quarter ended
1Q23
27,842
10,000
3,737
11
1,575
23,165
335
22,830
$0.81
28,086,823
2022
156,386
50,000
13,148
5,109
For the year ended
8,936
133,579
2,191
131,388
$4.49
29,232,247
2023
163,615
10,000
(1,993)
4,822
3,737
11
3,249
(942)
166,485
2,488
163,997
$6.09
26,925,606
pathwardView entire presentation