J.P.Morgan Results Presentation Deck
JPMORGAN CHASE & CO.
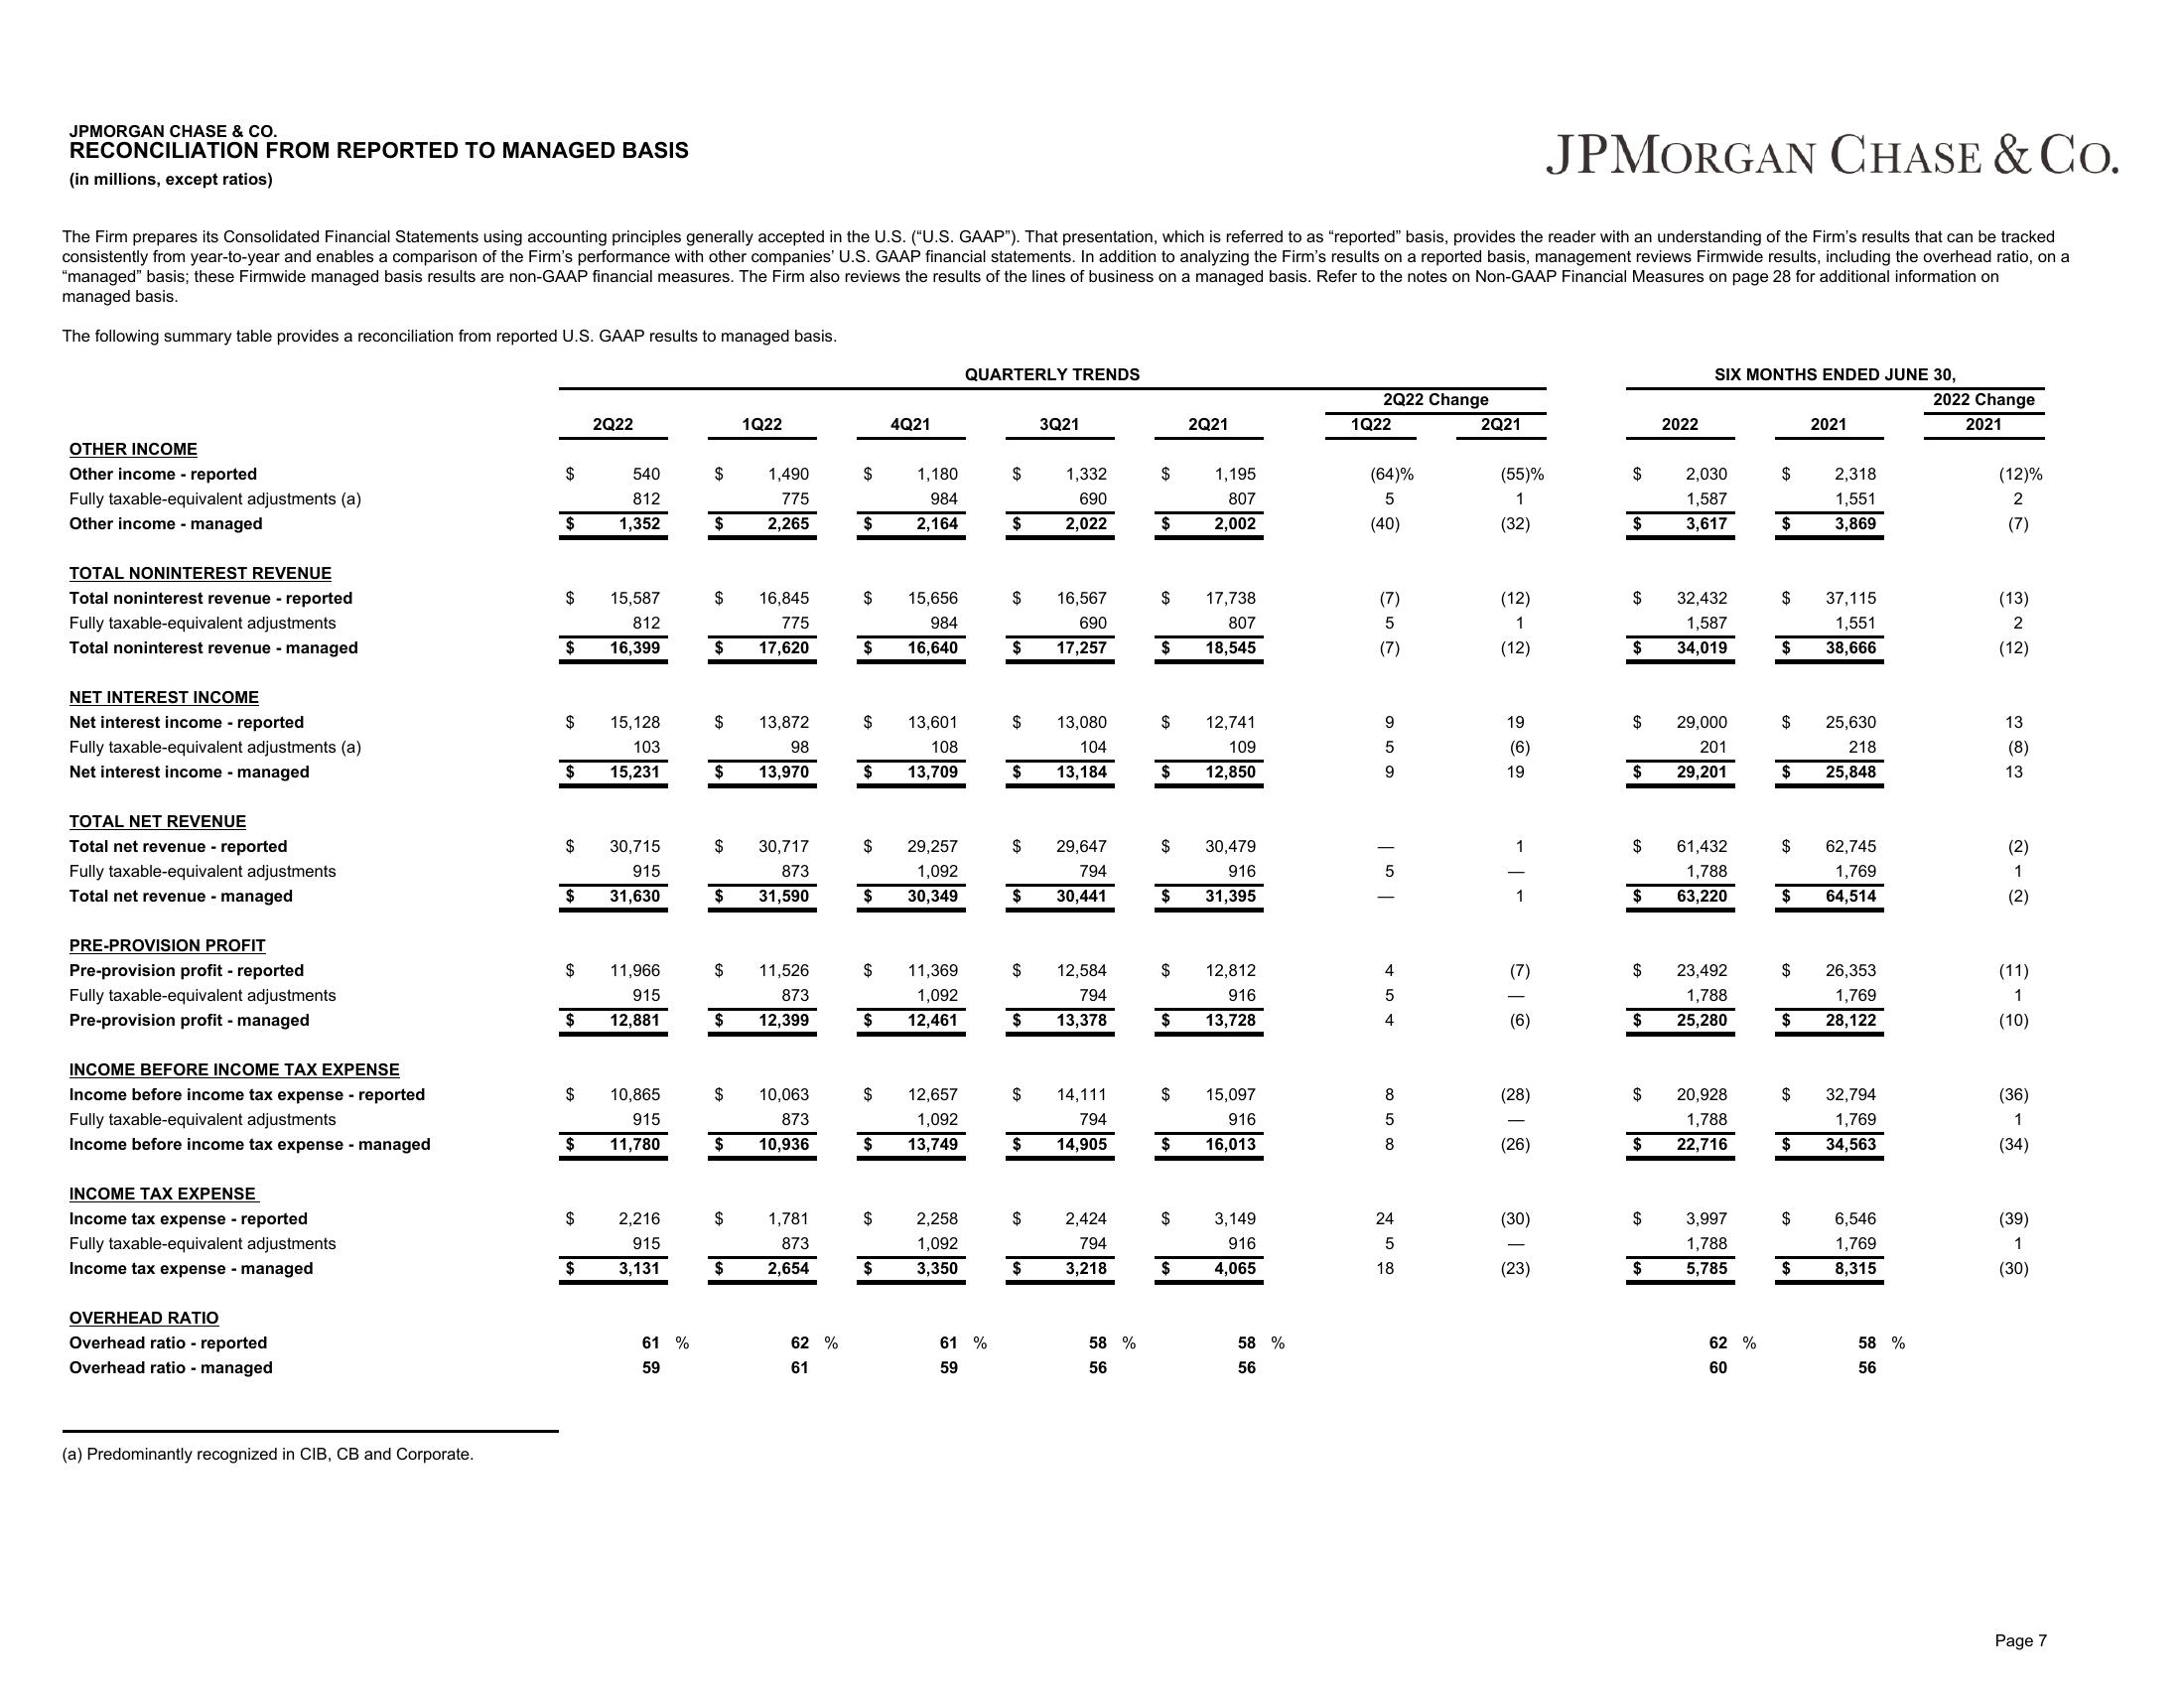
RECONCILIATION FROM REPORTED TO MANAGED BASIS
(in millions, except ratios)
JPMORGAN CHASE & CO.
The Firm prepares its Consolidated Financial Statements using accounting principles generally accepted in the U.S. ("U.S. GAAP"). That presentation, which is referred to as "reported" basis, provides the reader with an understanding of the Firm's results that can be tracked
consistently from year-to-year and enables a comparison of the Firm's performance with other companies' U.S. GAAP financial statements. In addition to analyzing the Firm's results on a reported basis, management reviews Firmwide results, including the overhead ratio, on a
"managed" basis; these Firmwide managed basis results are non-GAAP financial measures. The Firm also reviews the results of the lines of business on a managed basis. Refer to the notes on Non-GAAP Financial Measures on page 28 for additional information on
managed basis.
The following summary table provides a reconciliation from reported U.S. GAAP results to managed basis.
OTHER INCOME
Other income - reported
Fully taxable-equivalent adjustments (a)
Other income - managed
TOTAL NONINTEREST REVENUE
Total noninterest revenue reported
Fully taxable-equivalent adjustments
Total noninterest revenue managed
NET INTEREST INCOME
Net interest income - reported
Fully taxable-equivalent adjustments (a)
Net interest income-managed
TOTAL NET REVENUE
Total net revenue - reported
Fully taxable-equivalent adjustments
Total net revenue - managed
PRE-PROVISION PROFIT
Pre-provision profit - reported
Fully taxable-equivalent adjustments
Pre-provision profit - managed
INCOME BEFORE INCOME TAX EXPENSE
Income before income tax expense reported
Fully taxable-equivalent adjustments
Income before income tax expense managed
INCOME TAX EXPENSE
Income tax expense - reported
Fully taxable-equivalent adjustments
Income tax expense - managed
OVERHEAD RATIO
Overhead ratio - reported
Overhead ratio - managed
(a) Predominantly recognized in CIB, CB and Corporate.
$
$
$
$
$
$
$ 15,128
103
15,231
$
$
$
$
$
$
2Q22
$
540
812
1,352
15,587
812
16,399
30,715
915
31,630
11,966
915
12,881
10,865
915
11,780
2,216
915
3,131
61 %
59
$
$
$
$
$
$
$
$
$
$
$
$
$
$
1Q22
1,490
775
2,265
16,845
775
17,620
13,872
98
13,970
30,717
873
31,590
11,526
873
12,399
10,063
873
10,936
1,781
873
2,654
62 %
61
$
$
$
$
$
$
$
$
$ 29,257
1,092
30,349
$
4Q21
$
1,180
984
2,164
$ 11,369
1,092
12,461
$
15,656
984
16,640
13,601
108
13,709
12,657
1,092
13,749
2,258
1,092
$ 3,350
QUARTERLY TRENDS
61 %
59
$
$
$
$ 16,567
690
17,257
$
$
$
$
$
$
$
$
$
3Q21
$
1,332
690
2,022
13,080
104
13,184
29,647
794
30,441
12,584
794
13,378
14,111
794
14,905
2,424
794
3,218
58 %
56
$
$
$
$
$
$
$
$
$
$
$
$
$
$
2Q21
1,195
807
2,002
17,738
807
18,545
12,741
109
12,850
30,479
916
31,395
12,812
916
13,728
15,097
916
16,013
3,149
916
4,065
58 %
56
2Q22 Change
1Q22
(64)%
5
(40)
(7)
5
(7)
9
5
9
5
4
5
4
0000
8
5
8
24
5
18
2Q21
(55)%
-@_@-@
(32)
(12)
(12)
19
(6)
19
1
1
(7)
(6)
(28)
(26)
(30)
(23)
$
$ 2,030
1,587
3,617
$
$ 32,432
1,587
34,019
$
$ 29,000
201
29,201
$
$
$
2022
$
SIX MONTHS ENDED JUNE 30,
$
23,492
1,788
$ 25,280
$
$
61,432
1,788
63,220
20,928
1,788
22,716
3,997
1,788
5,785
62 %
60
$
$
$
$ 37,115
1,551
38,666
$
$
$
$
$
$
$
$
$
2021
$
2,318
1,551
3,869
25,630
218
25,848
62,745
1,769
64,514
26,353
1,769
28,122
32,794
1,769
34,563
6,546
1,769
8,315
58 %
56
2022 Change
2021
(12)%
2
(7)
(13)
2
(12)
13
(8)
13
(2)
1
(2)
(11)
1
(10)
(36)
1
(34)
(39)
1
(30)
Page 7View entire presentation