XP Inc Results Presentation Deck
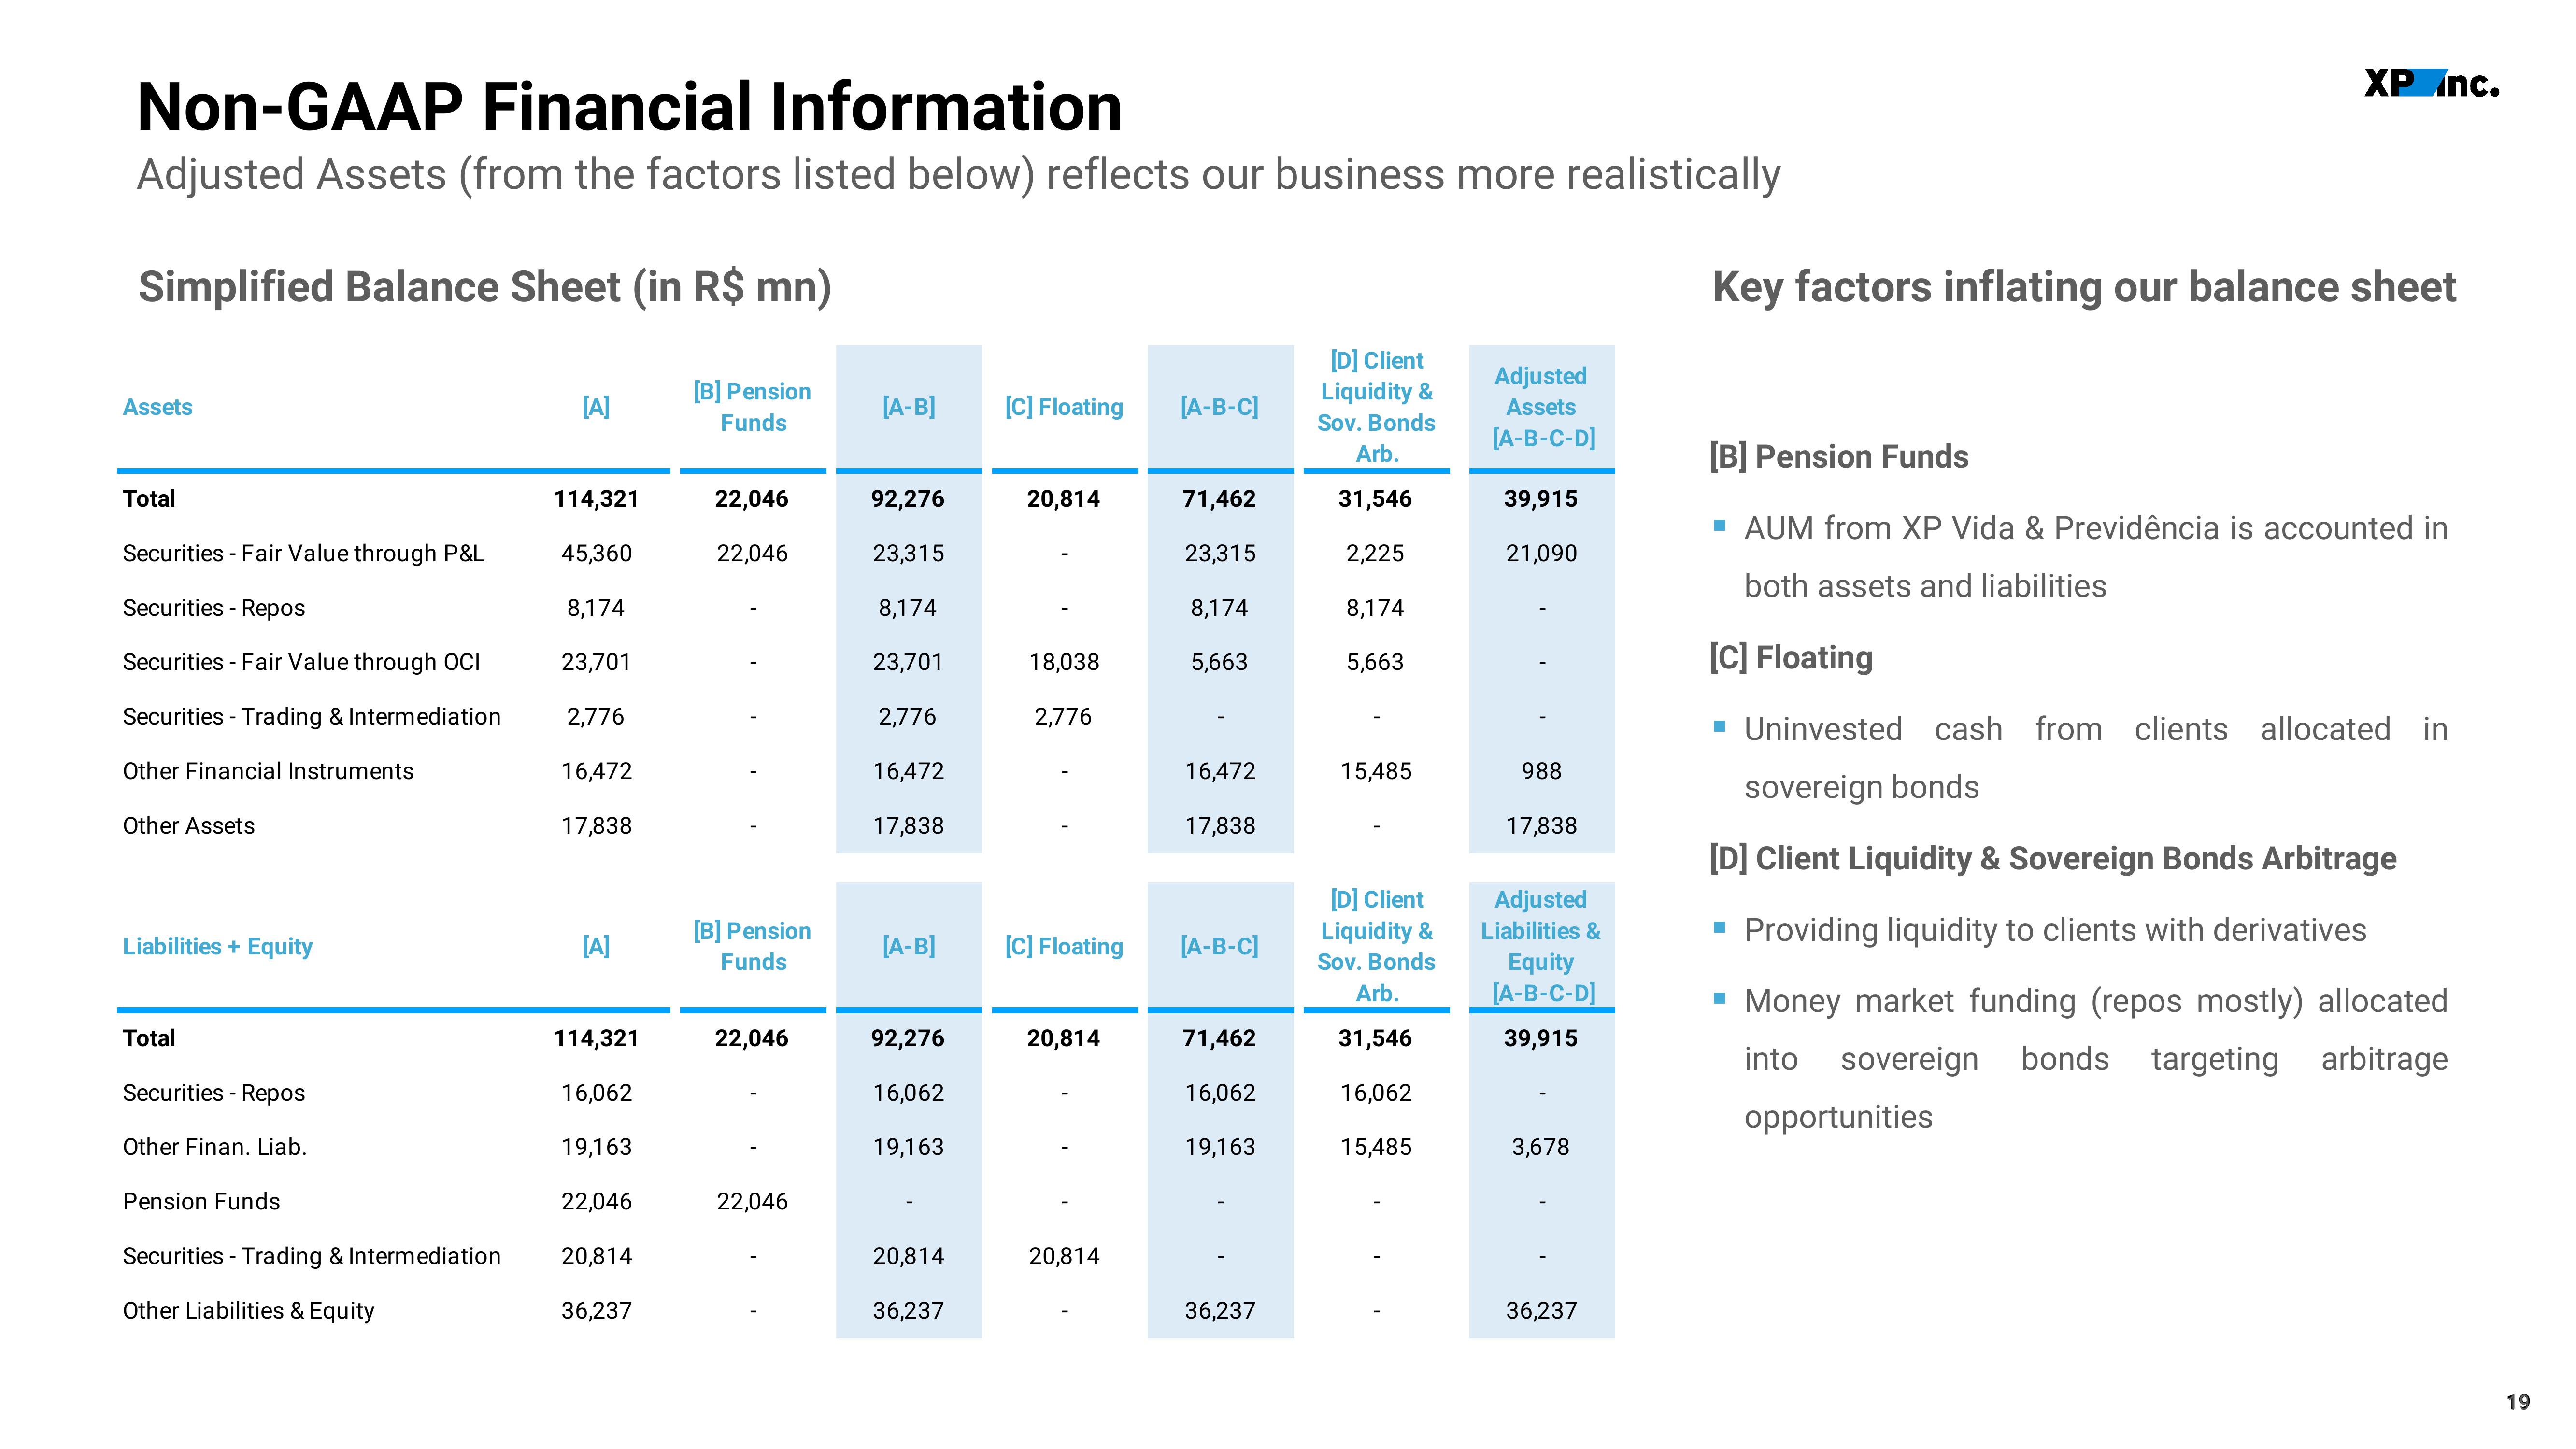
Non-GAAP Financial Information
Adjusted Assets (from the factors listed below) reflects our business more realistically
Simplified Balance Sheet (in R$ mn)
[B] Pension
Funds
Assets
Total
Securities - Fair Value through P&L
Securities Repos
Securities Fair Value through OCI
Securities - Trading & Intermediation
Other Financial Instruments
Other Assets
Liabilities + Equity
Total
Securities - Repos
Other Finan. Liab.
Pension Funds
Securities - Trading & Intermediation
Other Liabilities & Equity
[A]
114,321
45,360
8,174
23,701
2,776
16,472
17,838
[A]
114,321
16,062
19,163
22,046
20,814
36,237
22,046
22,046
[B] Pension
Funds
22,046
22,046
[A-B] [C] Floating [A-B-C]
92,276
23,315
8,174
23,701
2,776
16,472
17,838
[A-B]
92,276
16,062
19,163
20,814
36,237
20,814
18,038
2,776
[C] Floating
20,814
20,814
71,462
23,315
8,174
5,663
16,472
17,838
[A-B-C]
71,462
16,062
19,163
36,237
[D] Client
Liquidity &
Sov. Bonds
Arb.
31,546
2,225
8,174
5,663
15,485
[D] Client
Liquidity &
Sov. Bonds
Arb.
31,546
16,062
15,485
Adjusted
Assets
[A-B-C-D]
39,915
21,090
988
17,838
Adjusted
Liabilities &
Equity
[A-B-C-D]
39,915
3,678
36,237
Key factors inflating our balance sheet
XP Inc.
[B] Pension Funds
▪ AUM from XP Vida & Previdência is accounted in
both assets and liabilities
[C] Floating
▪ Uninvested cash from clients allocated in
sovereign bonds
[D] Client Liquidity & Sovereign Bonds Arbitrage
Providing liquidity to clients with derivatives
▪ Money market funding (repos mostly) allocated
into sovereign bonds targeting arbitrage
■
opportunities
60
19View entire presentation