Vivid Seats Results Presentation Deck
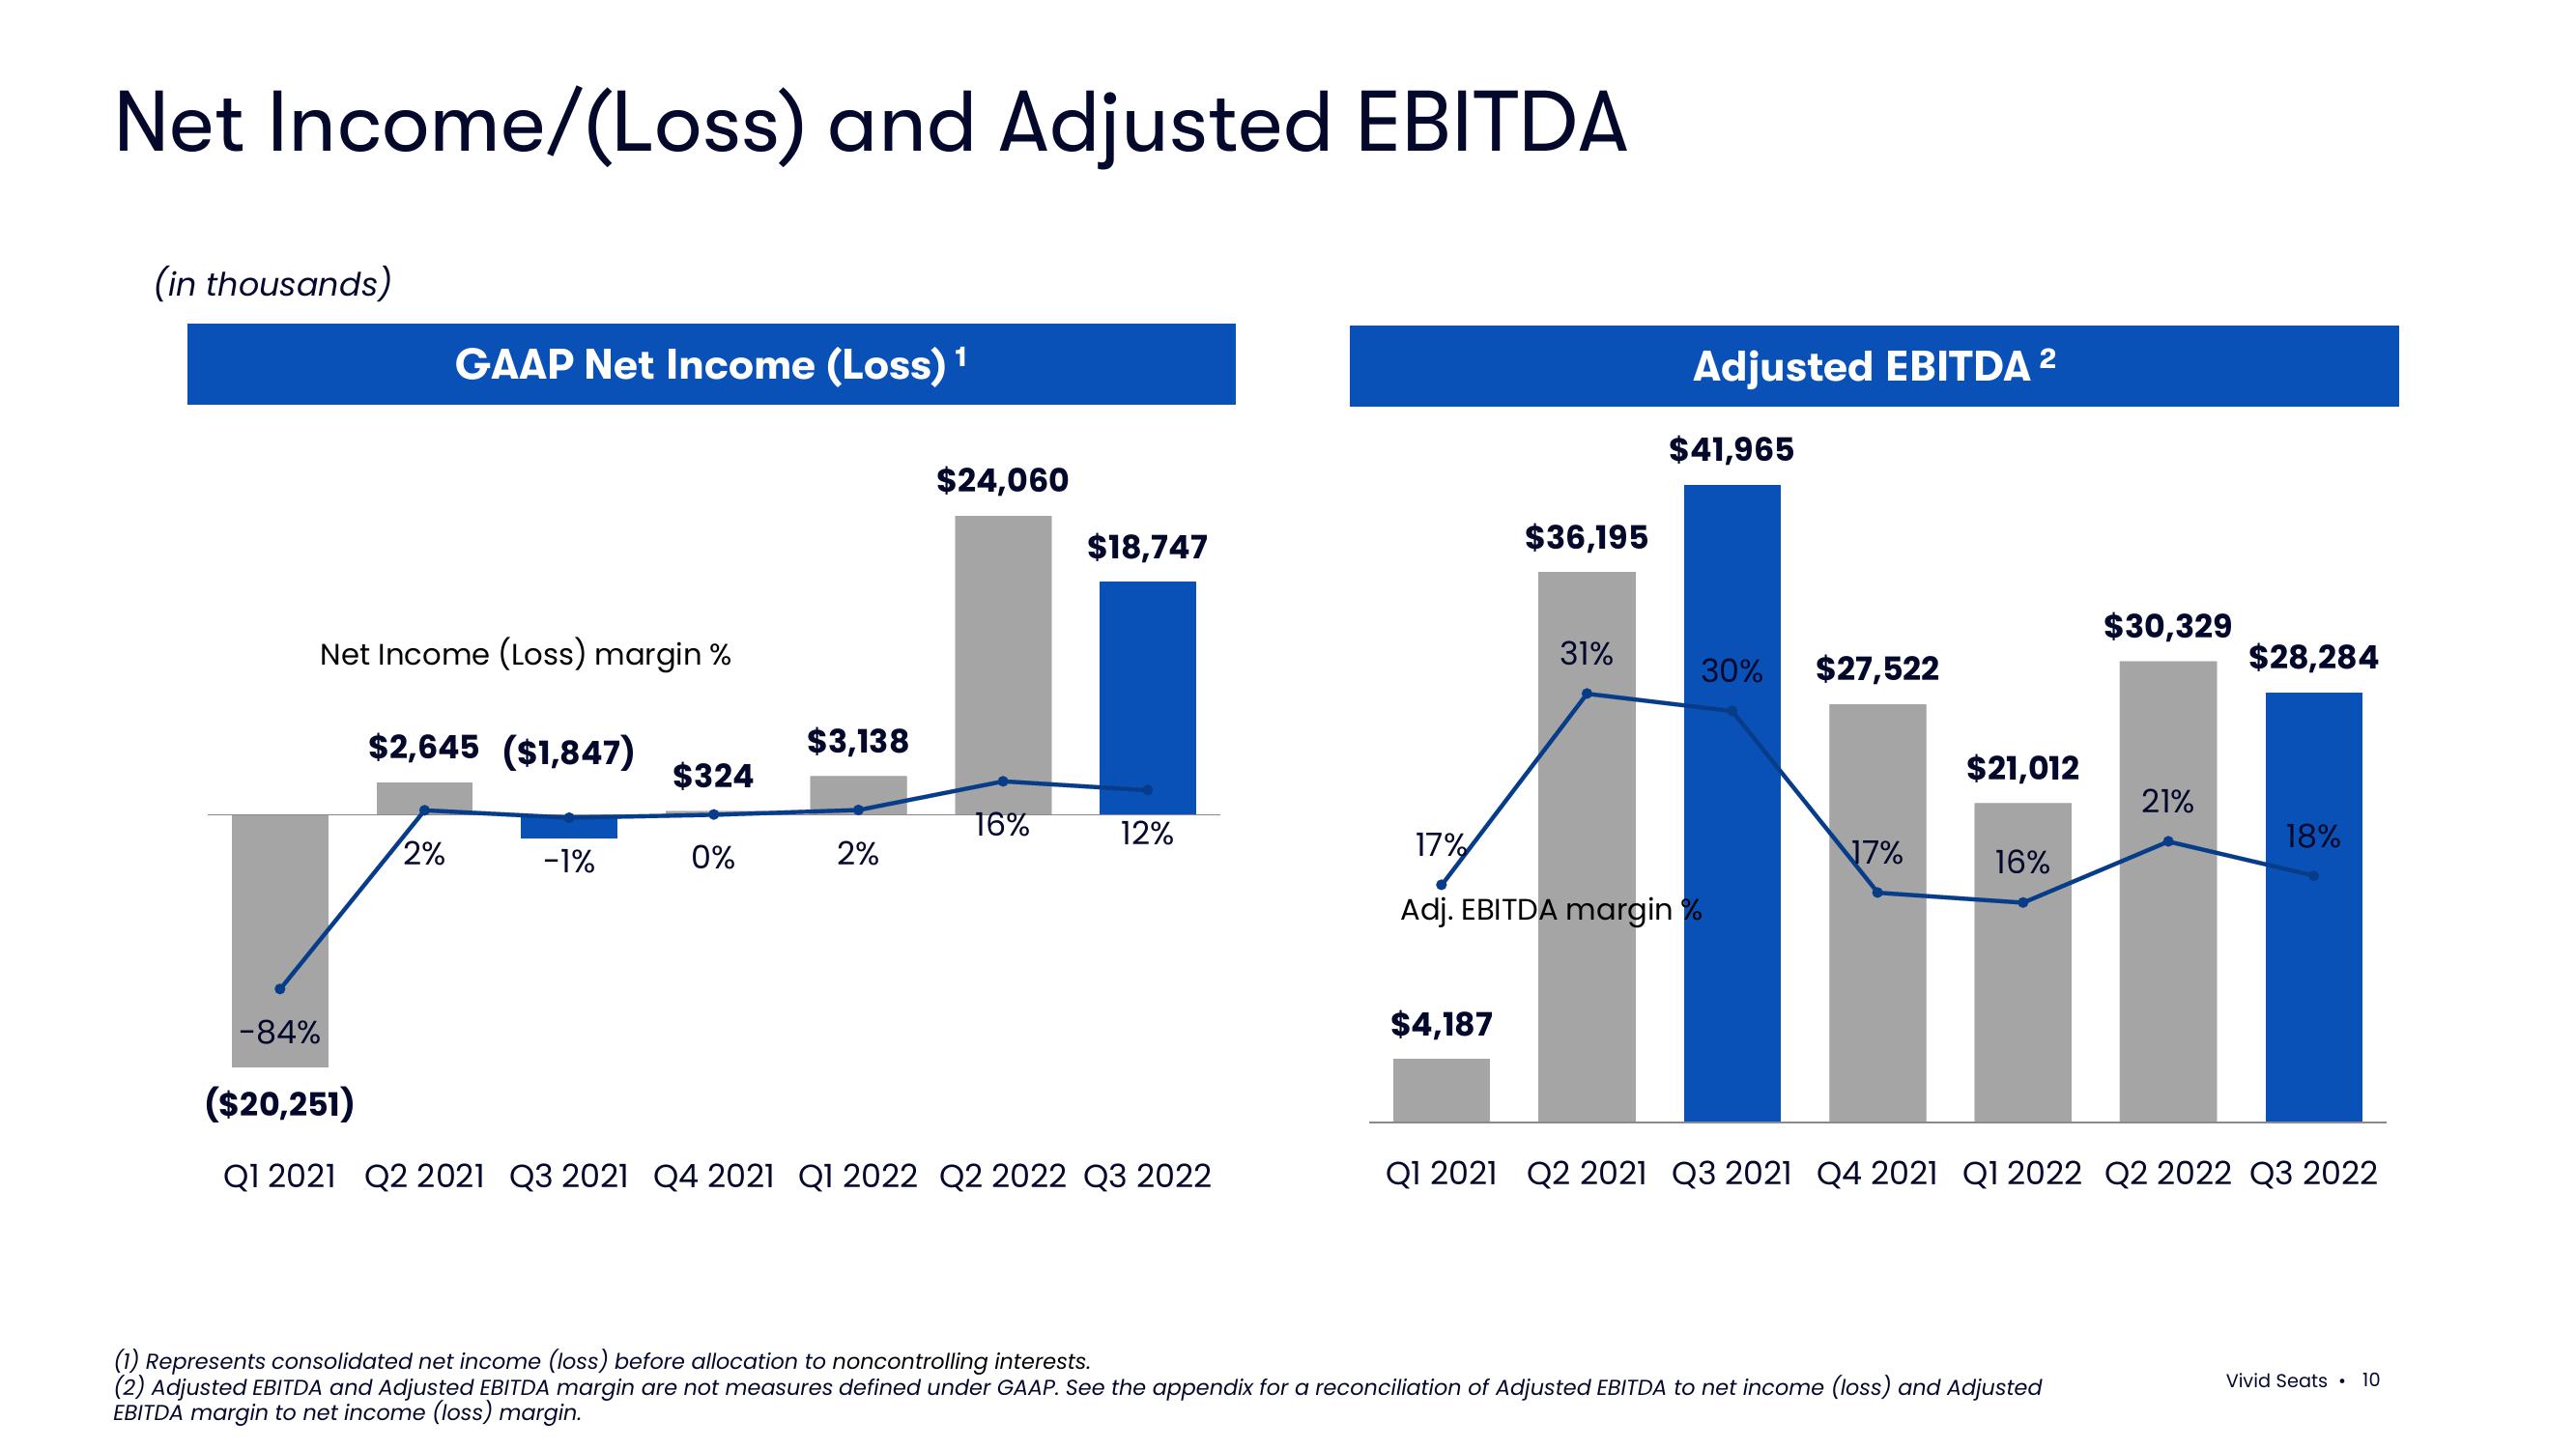
Net Income/(Loss) and Adjusted EBITDA
(in thousands)
GAAP Net Income (Loss) ¹
Net Income (Loss) margin %
$2,645 ($1,847)
2%
-1%
$324
0%
$3,138
2%
$24,060
16%
$18,747
12%
-84%
($20,251)
Q1 2021 Q2 2021 Q3 2021 Q4 2021 Q1 2022 Q2 2022 Q3 2022
17%
$36,195
$4,187
31%
Adjusted EBITDA ²
2
$41,965
30% $27,522
Adj. EBITDA margin %
N7%
$21,012
16%
$30,329
(1) Represents consolidated net income (loss) before allocation to noncontrolling interests.
(2) Adjusted EBITDA and Adjusted EBITDA margin are not measures defined under GAAP. See the appendix for a reconciliation of Adjusted EBITDA to net income (loss) and Adjusted
EBITDA margin to net income (loss) margin.
21%
$28,284
18%
Q1 2021 Q2 2021 Q3 2021 Q4 2021 Q1 2022 Q2 2022 Q3 2022
Vivid Seats. 10View entire presentation