Getty SPAC Presentation Deck
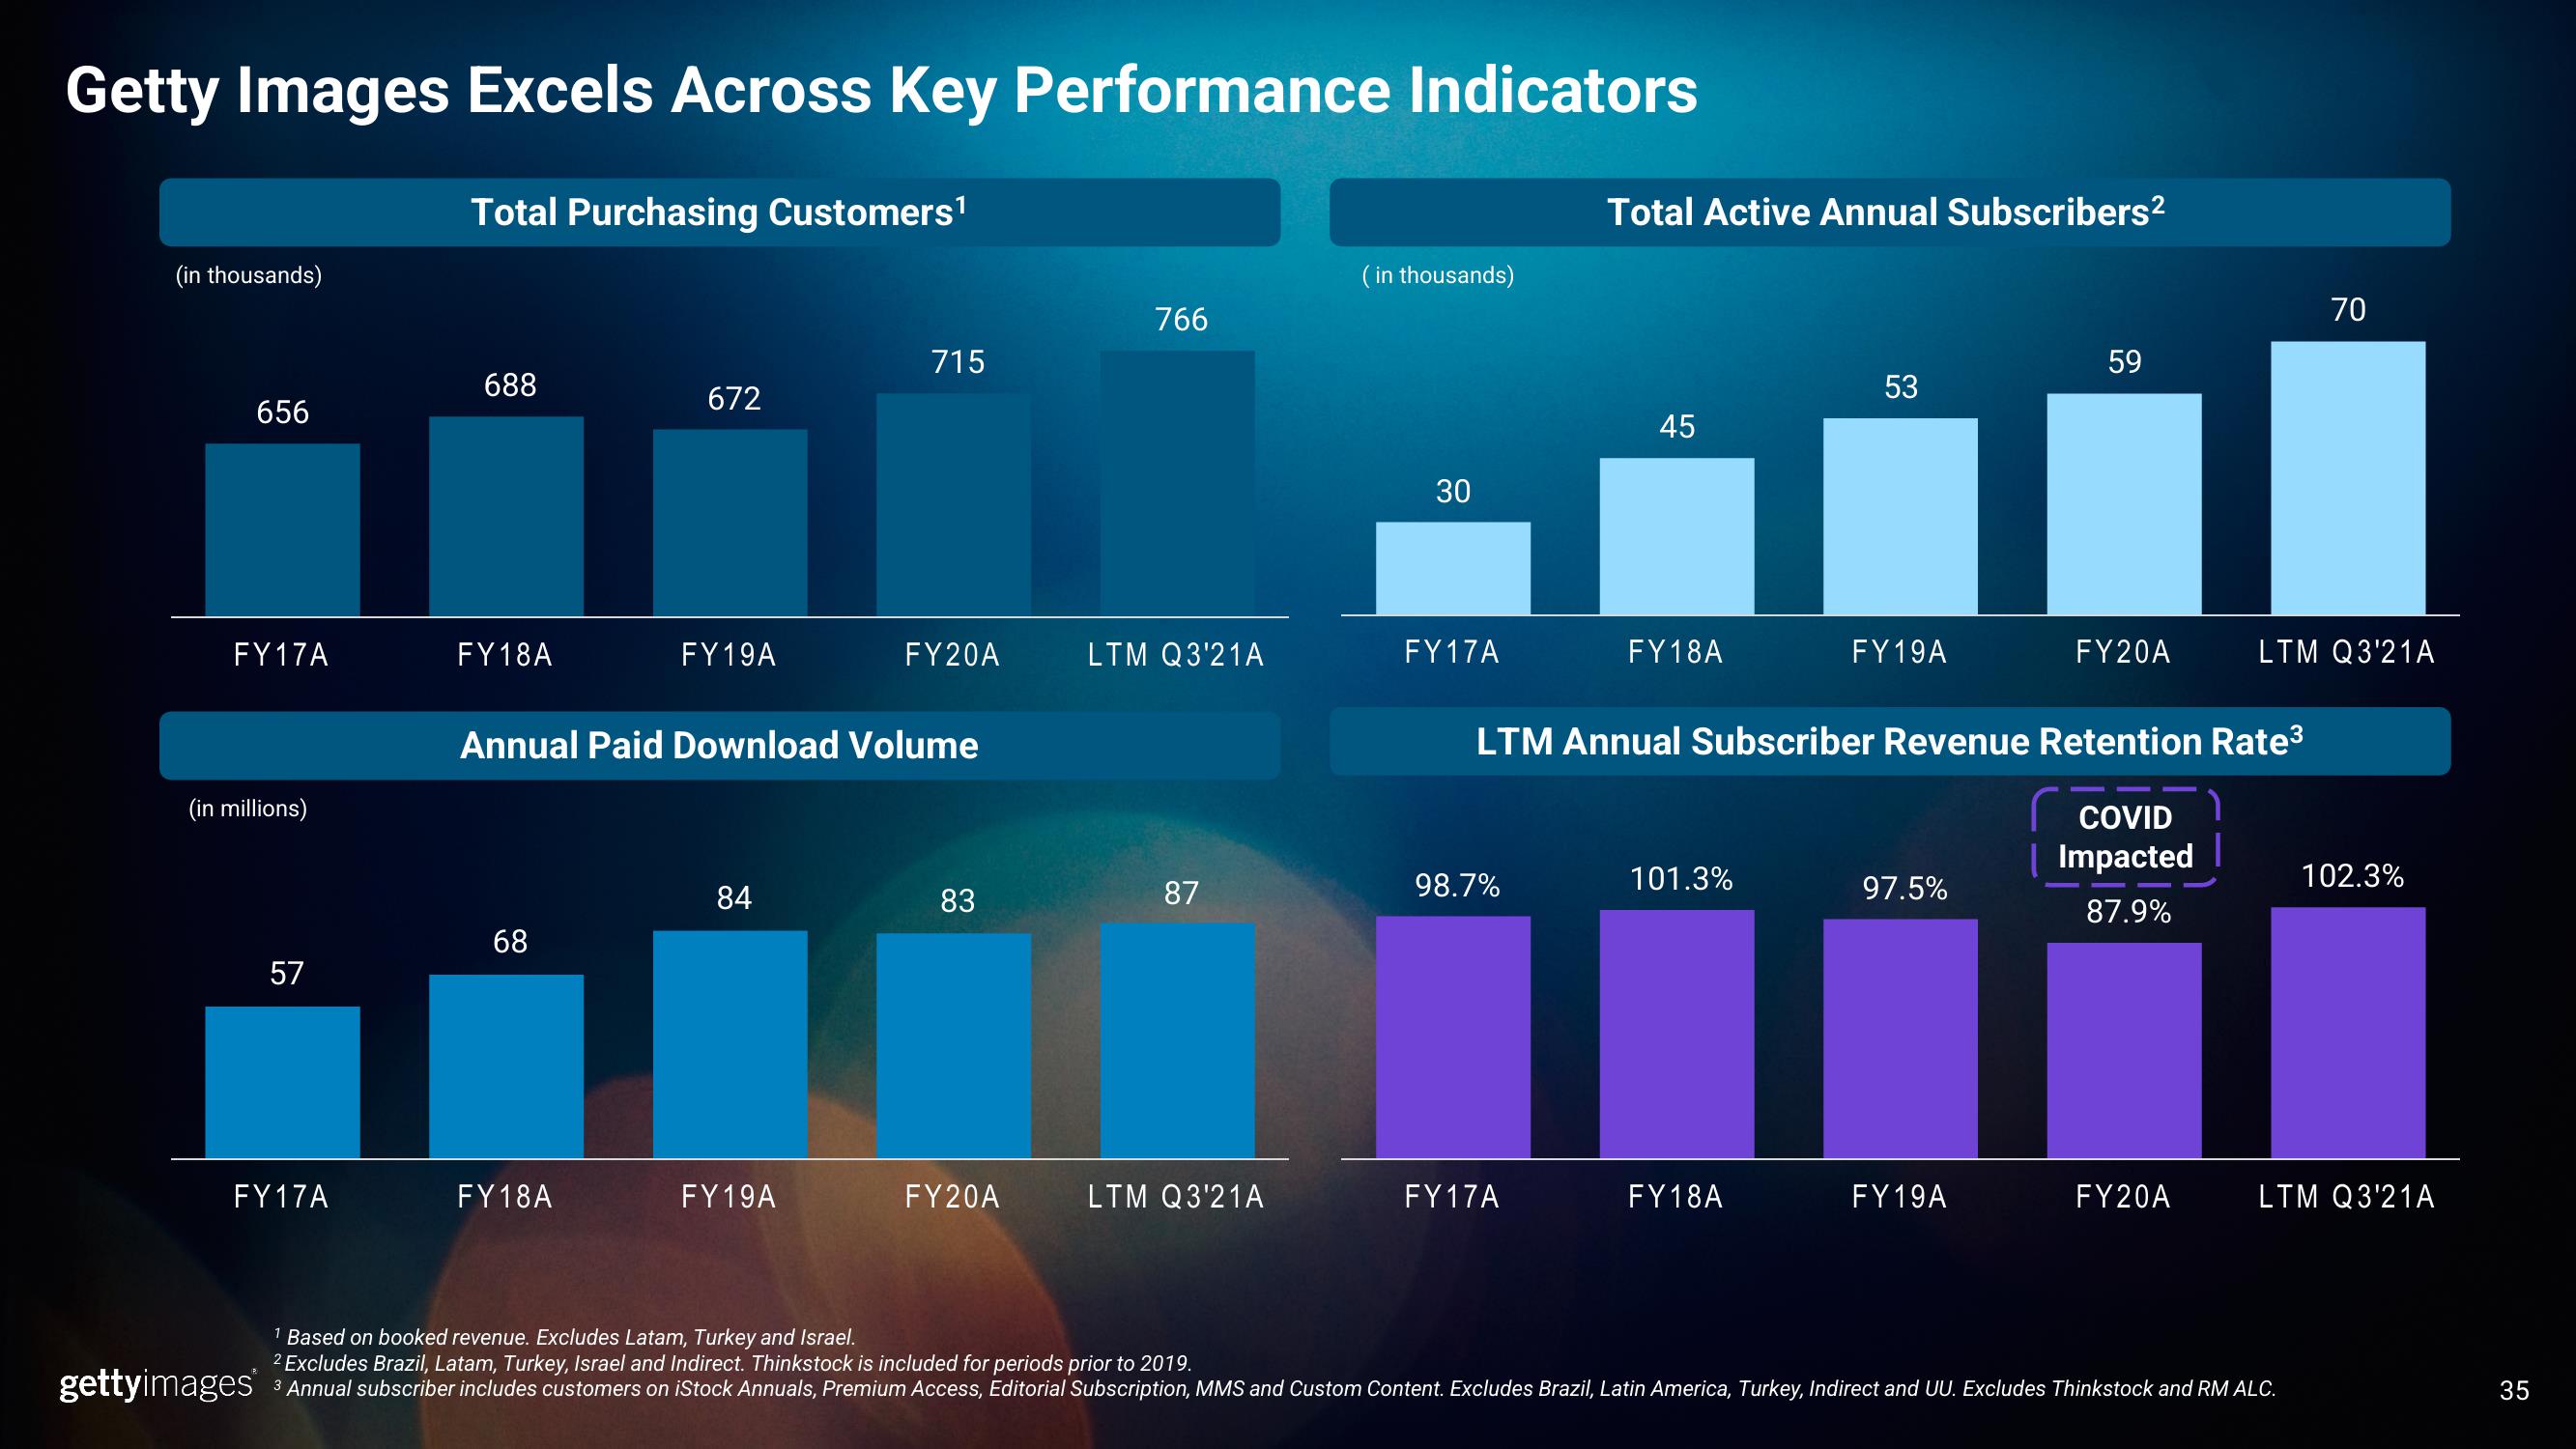
Getty Images Excels Across Key Performance Indicators
(in thousands)
656
FY17A
(in millions)
gettyimages
57
FY17A
Total Purchasing Customers¹
688
FY18A
68
672
FY18A
FY19A
Annual Paid Download Volume
84
715
FY19A
FY20A
83
FY20A
766
LTM Q3'21A
87
LTM Q3'21A
(in thousands)
30
FY17A
98.7%
Total Active Annual Subscribers²
FY17A
45
FY18A
101.3%
53
FY18A
FY19A
LTM Annual Subscriber Revenue Retention Rate³
COVID
Impacted
87.9%
97.5%
59
FY19A
FY20A
FY20A
LTM Q3'21A
70
¹ Based on booked revenue. Excludes Latam, Turkey and Israel.
2 Excludes Brazil, Latam, Turkey, Israel and Indirect. Thinkstock is included for periods prior to 2019.
3 Annual subscriber includes customers on iStock Annuals, Premium Access, Editorial Subscription, MMS and Custom Content. Excludes Brazil, Latin America, Turkey, Indirect and UU. Excludes Thinkstock and RM ALC.
102.3%
LTM Q3'21A
35View entire presentation