Investor Presentation slide image

Investor Presentation

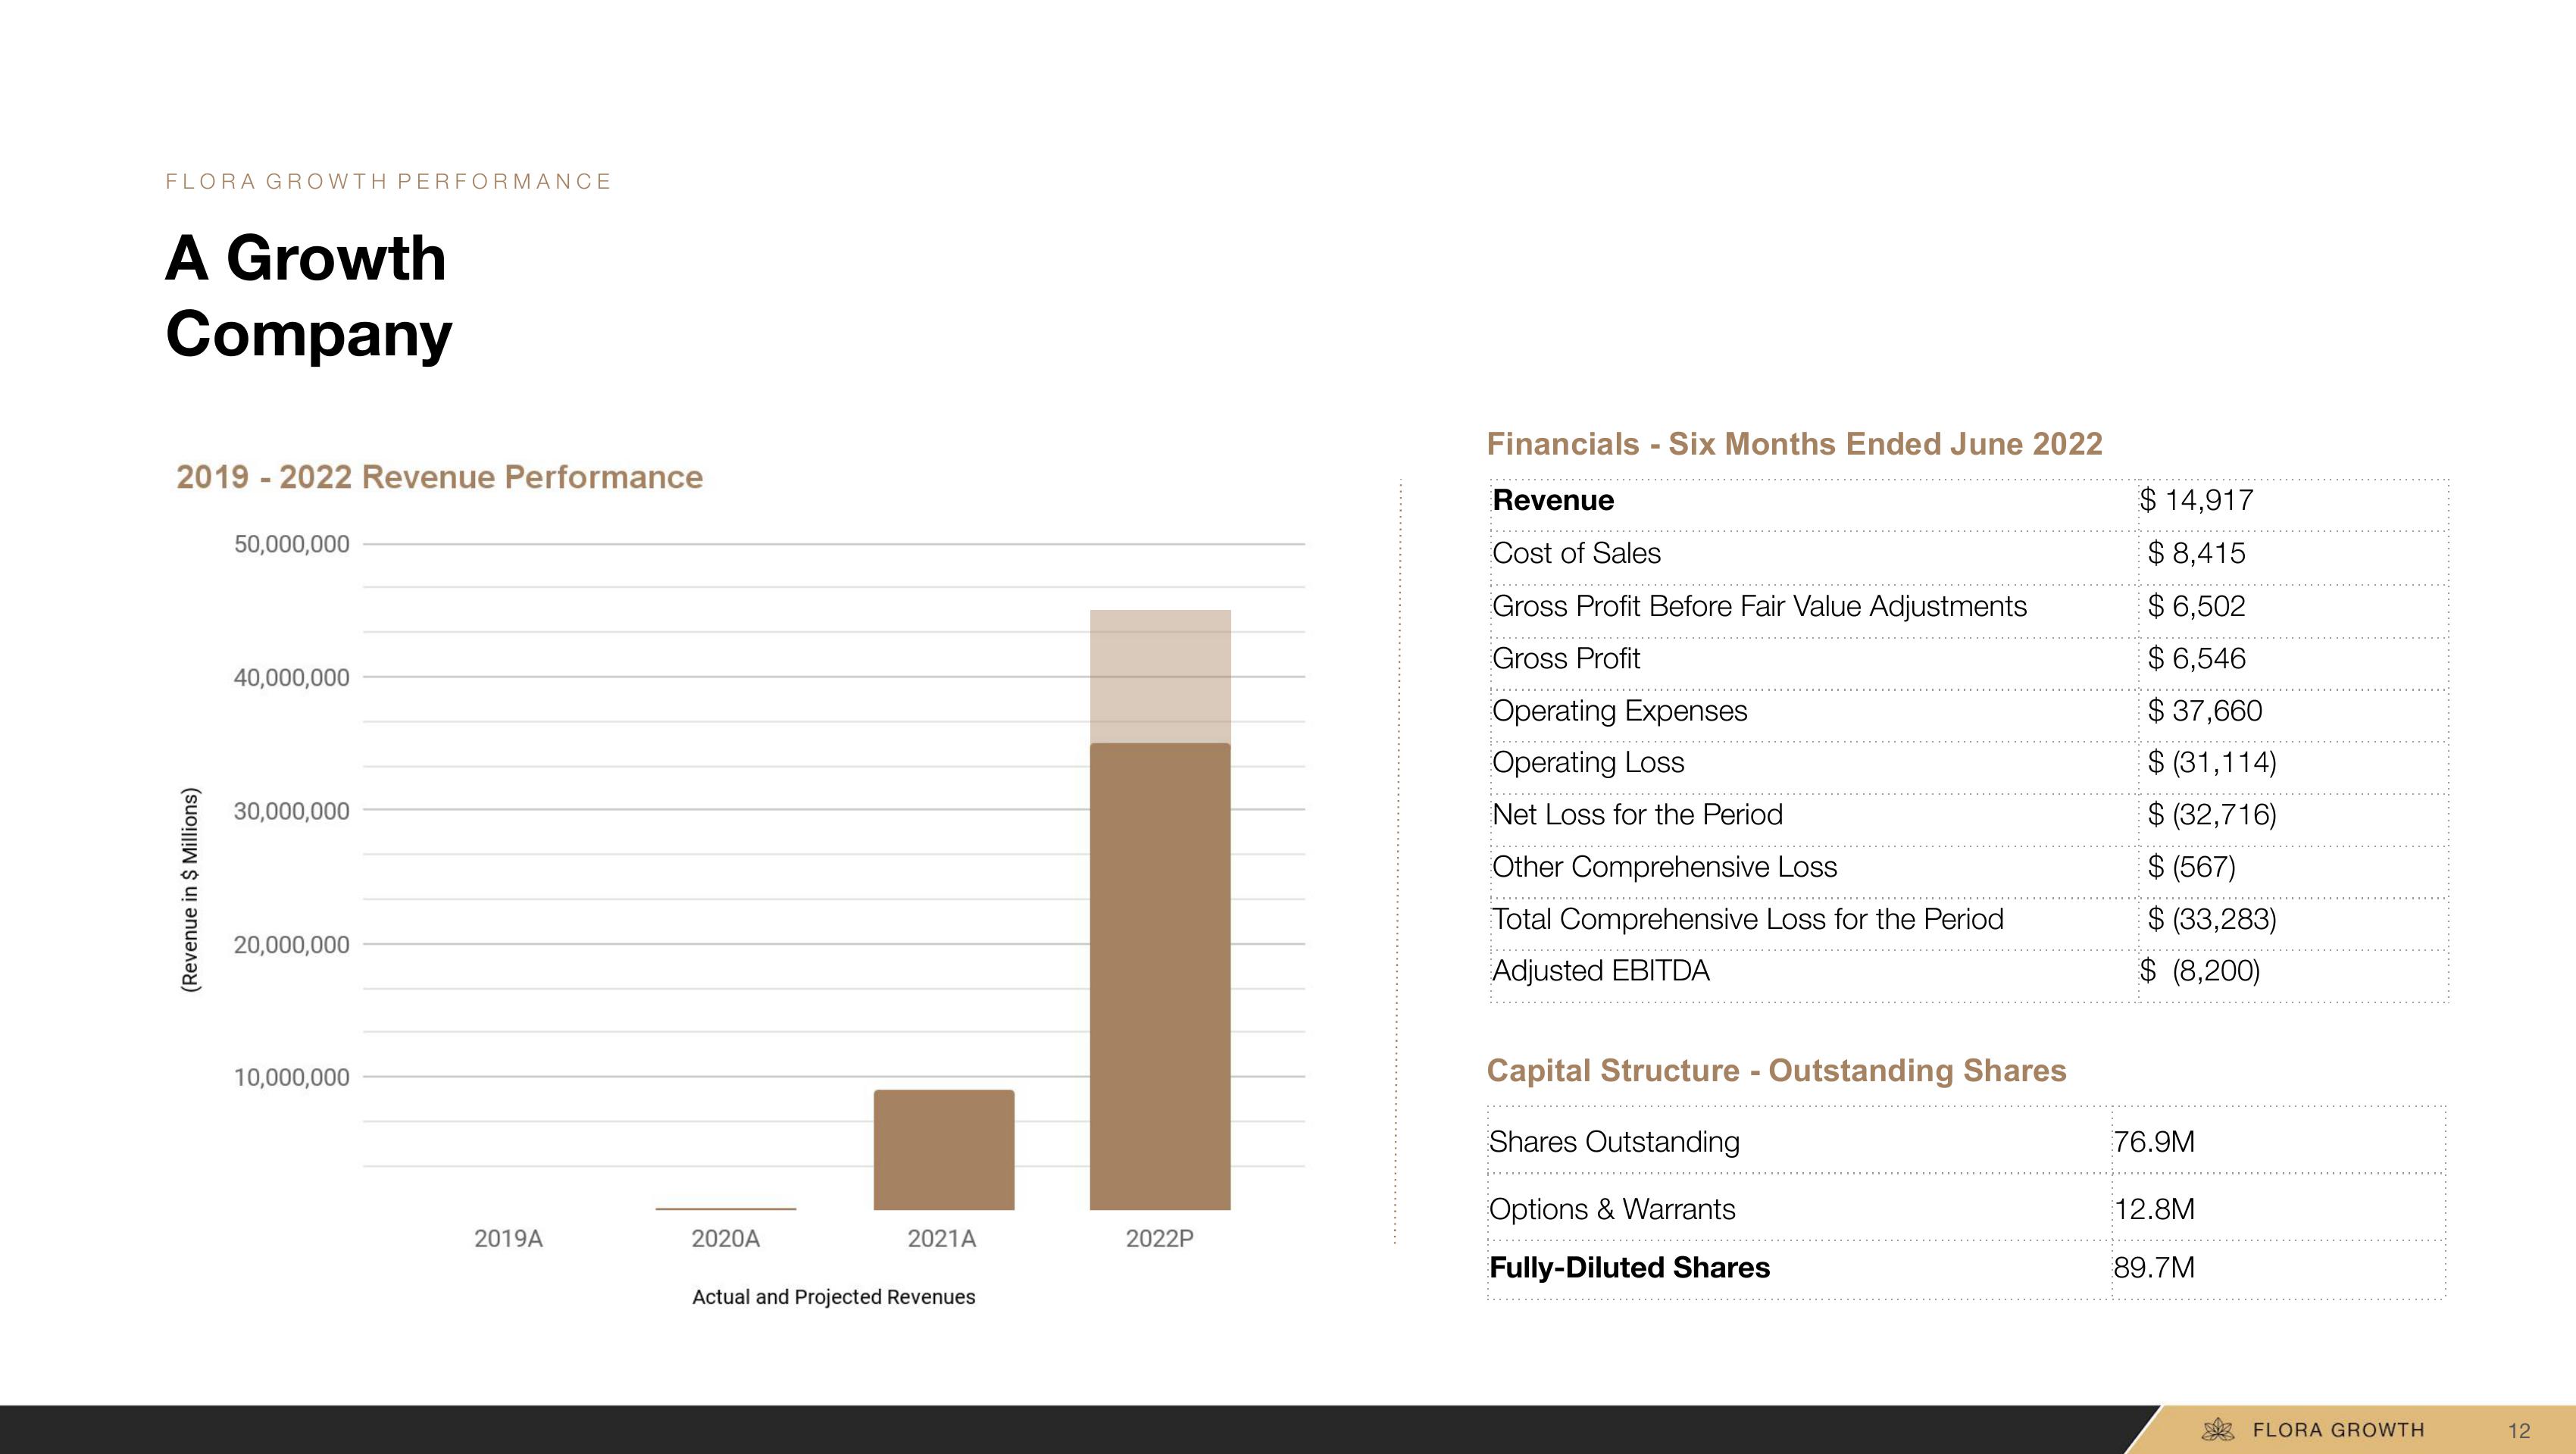
FLORA GROWTH PERFORMANCE A Growth Company 2019-2022 Revenue Performance (Revenue in $ Millions) 50,000,000 40,000,000 30,000,000 20,000,000 10,000,000 2019A 2020A 2021A Actual and Projected Revenues 2022P Financials - Six Months Ended June 2022 Revenue Cost of Sales Gross Profit Before Fair Value Adjustments Gross Profit Operating Expenses Operating Loss Net Loss for the Period Other Comprehensive Loss Total Comprehensive Loss for the Period Adjusted EBITDA Capital Structure - Outstanding Shares Shares Outstanding Options & Warrants Fully-Diluted Shares $14,917 $8,415 $6,502 $ 6,546 $37,660 $ (31,114) $ (32,716) $ (567) $ (33,283) $ (8,200) 76.9M 12.8M 89.7M FLORA GROWTH 12
View entire presentation