Kinnevik Results Presentation Deck
Intro
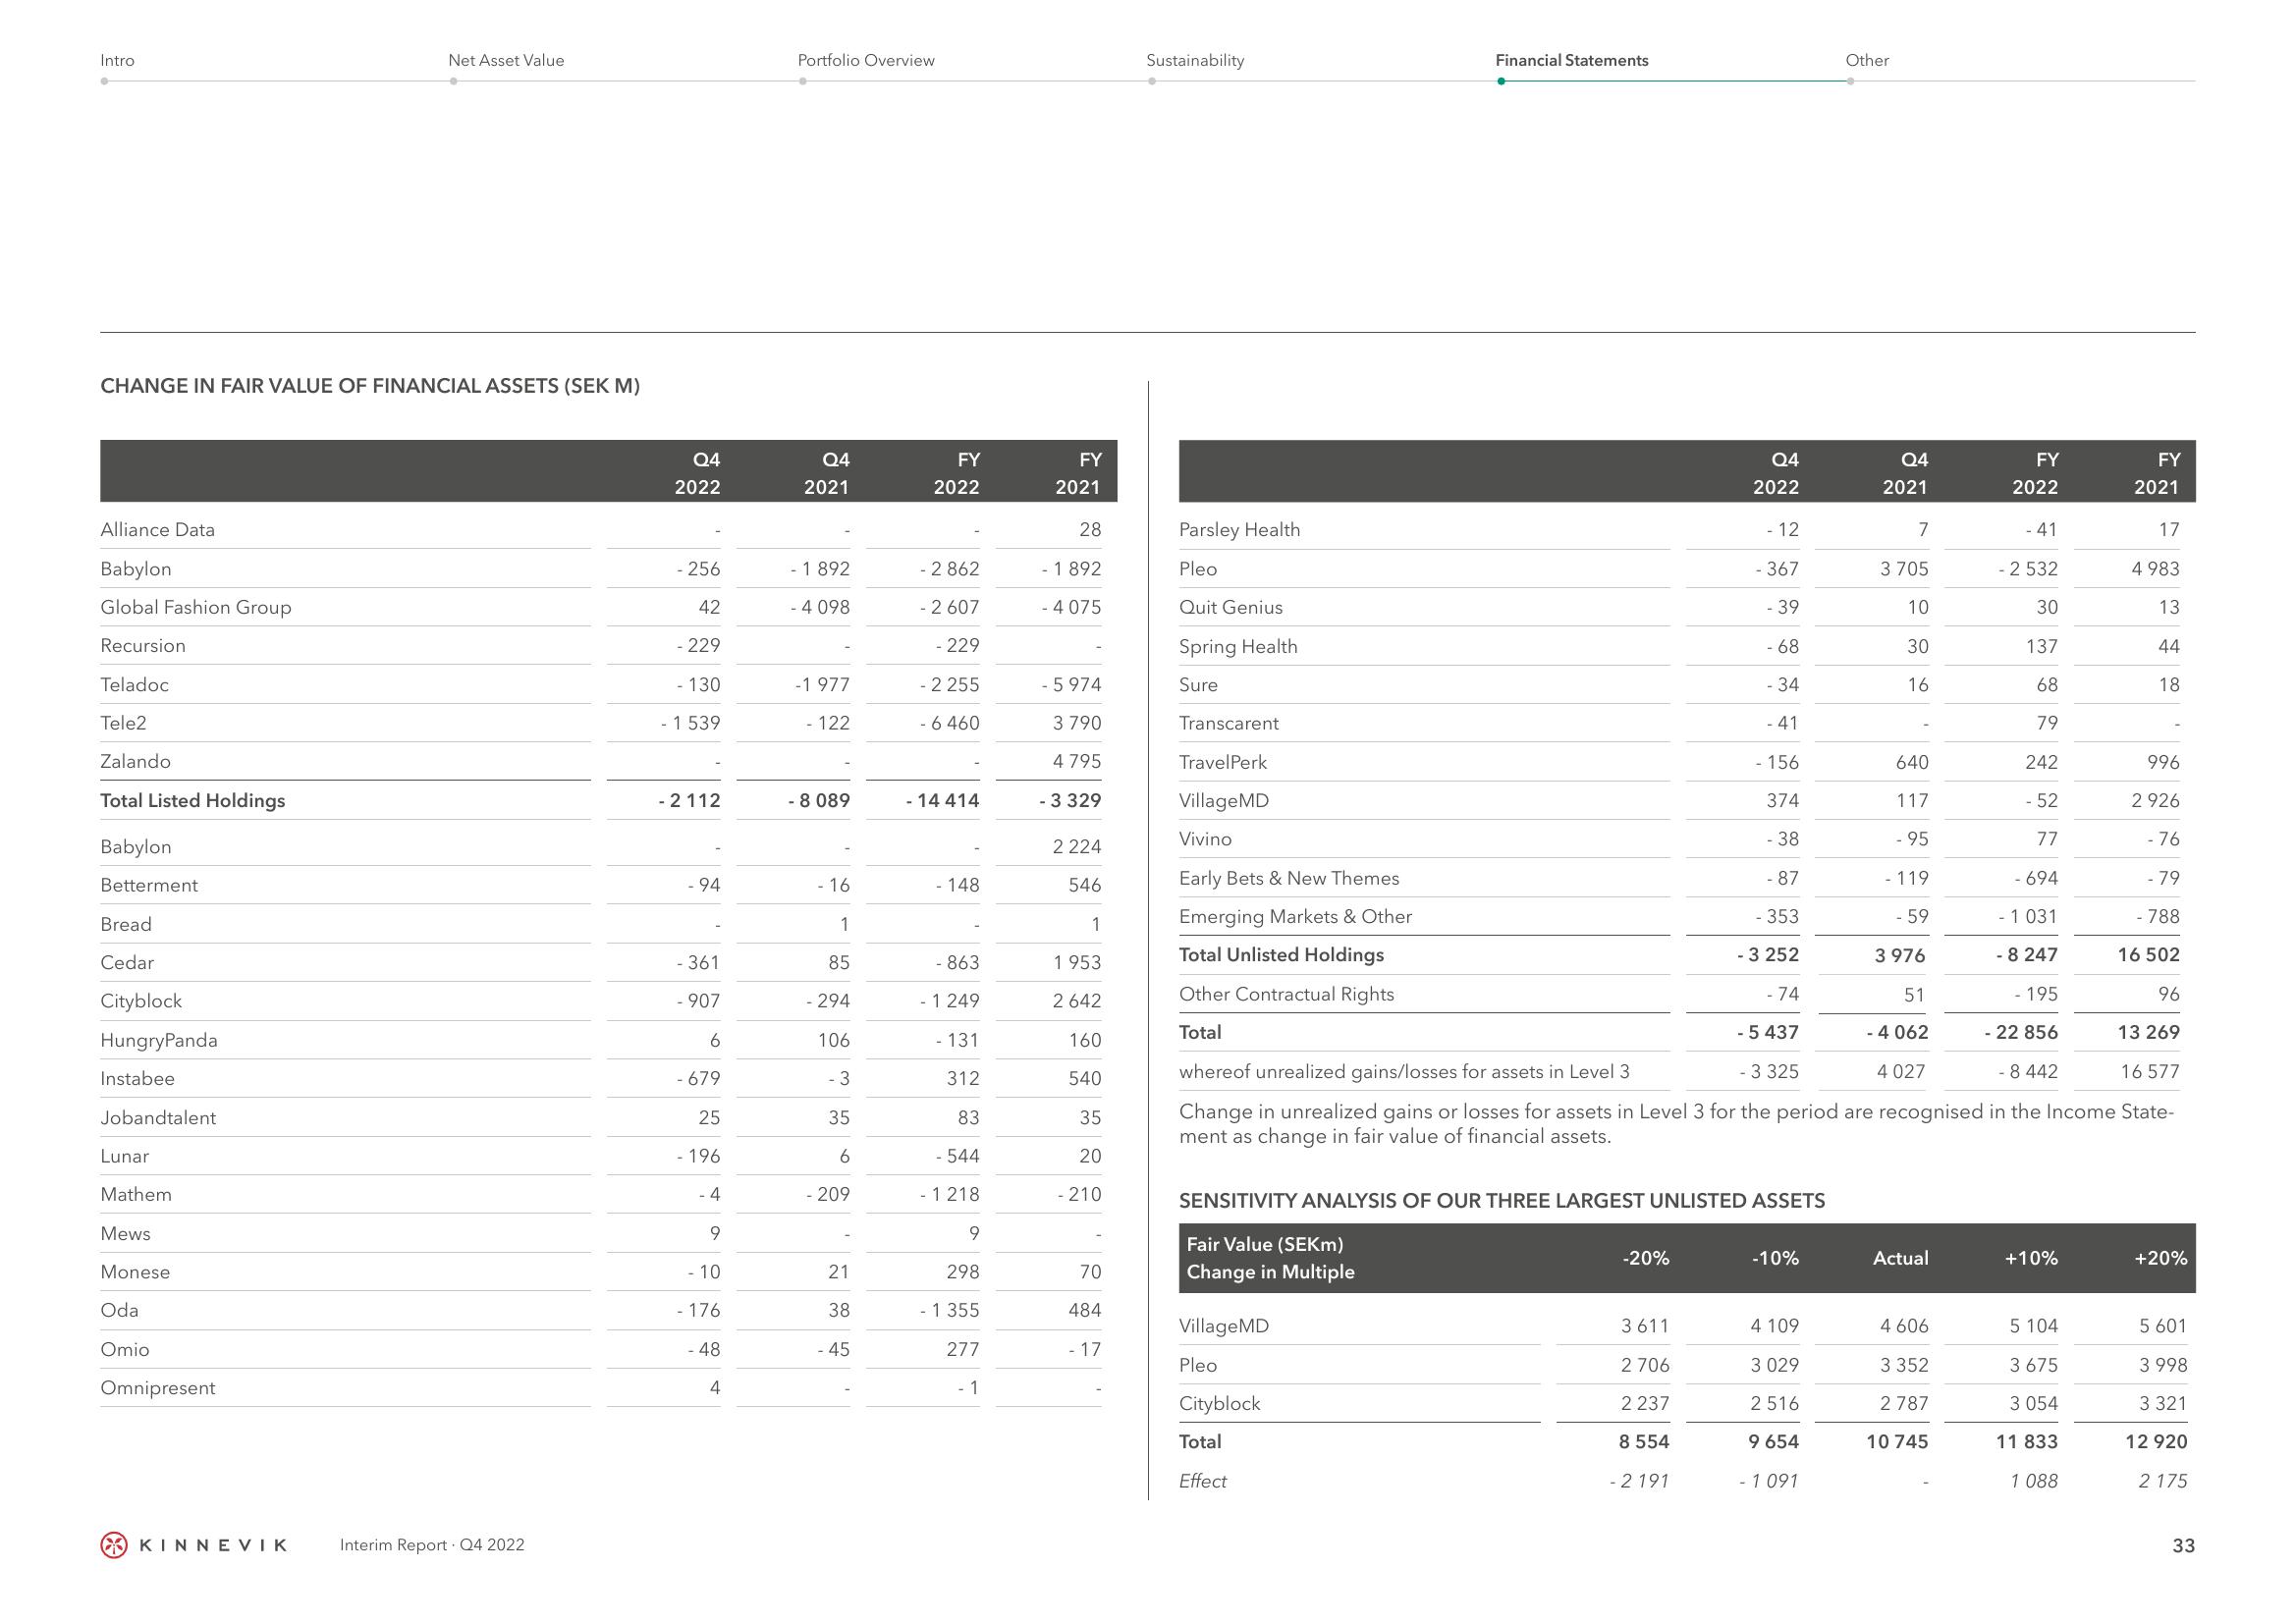
CHANGE IN FAIR VALUE OF FINANCIAL ASSETS (SEK M)
Alliance Data
Babylon
Global Fashion Group
Recursion
Teladoc
Tele2
Zalando
Total Listed Holdings
Babylon
Betterment
Bread
Cedar
Cityblock
HungryPanda
Instabee
Jobandtalent
Lunar
Mathem
Mews
Monese
Oda
Omio
Omnipresent
Net Asset Value
KINNEVIK
Interim Report Q4 2022
Q4
2022
- 256
42
- 229
- 130
- 1 539
- 2112
- 94
- 361
- 907
6
- 679
25
- 196
4
9
- 10
- 176
- 48
4
Portfolio Overview
Q4
2021
- 1 892
- 4 098
-1 977
- 122
- 8 089
- 16
1
85
- 294
106
- 3
35
6
- 209
21
38
- 45
FY
2022
- 2 862
- 2 607
- 229
- 2 255
- 6 460
- 14 414
- 148
- 863
- 1 249
- 131
312
83
- 544
- 1 218
9
298
- 1 355
277
1
FY
2021
28
- 1892
- 4 075
-5974
3 790
4 795
- 3 329
2224
546
1
1953
2642
160
540
35
20
- 210
70
484
- 17
Sustainability
Parsley Health
Pleo
Quit Genius
Spring Health
Sure
Transcarent
TravelPerk
Village MD
Vivino
Early Bets & New Themes
Emerging Markets & Other
Total Unlisted Holdings
Other Contractual Rights
Total
Financial Statements
Village MD
Pleo
Cityblock
Total
Effect
Q4
2022
-20%
- 12
3611
2 706
2237
8 554
- 2 191
- 367
- 39
- 68
- 34
- 41
- 156
374
- 38
- 87
- 353
- 3 252
SENSITIVITY ANALYSIS OF OUR THREE LARGEST UNLISTED ASSETS
Fair Value (SEKm)
Change in Multiple
- 74
- 5 437
-10%
4 109
3 029
2516
Other
9 654
- 1 091
Q4
2021
7
3 705
10
30
16
640
117
- 95
- 119
- 59
3 976
51
- 4 062
4 027
Actual
- 3 325
- 8 442
16 577
whereof unrealized gains/losses for assets in Level 3
Change in unrealized gains or losses for assets in Level 3 for the period are recognised in the Income State-
ment as change in fair value of financial assets.
4 606
FY
2022
3 352
2 787
10 745
- 41
- 2 532
30
137
68
79
242
- 52
77
- 694
- 1 031
- 8 247
- 195
22 856
+10%
FY
2021
5 104
3 675
3 054
11 833
1 088
17
4 983
13
44
18
996
2 926
-76
- 79
- 788
16 502
96
13 269
+20%
5 601
3 998
3 321
12 920
2 175
33View entire presentation