Doma SPAC Presentation Deck
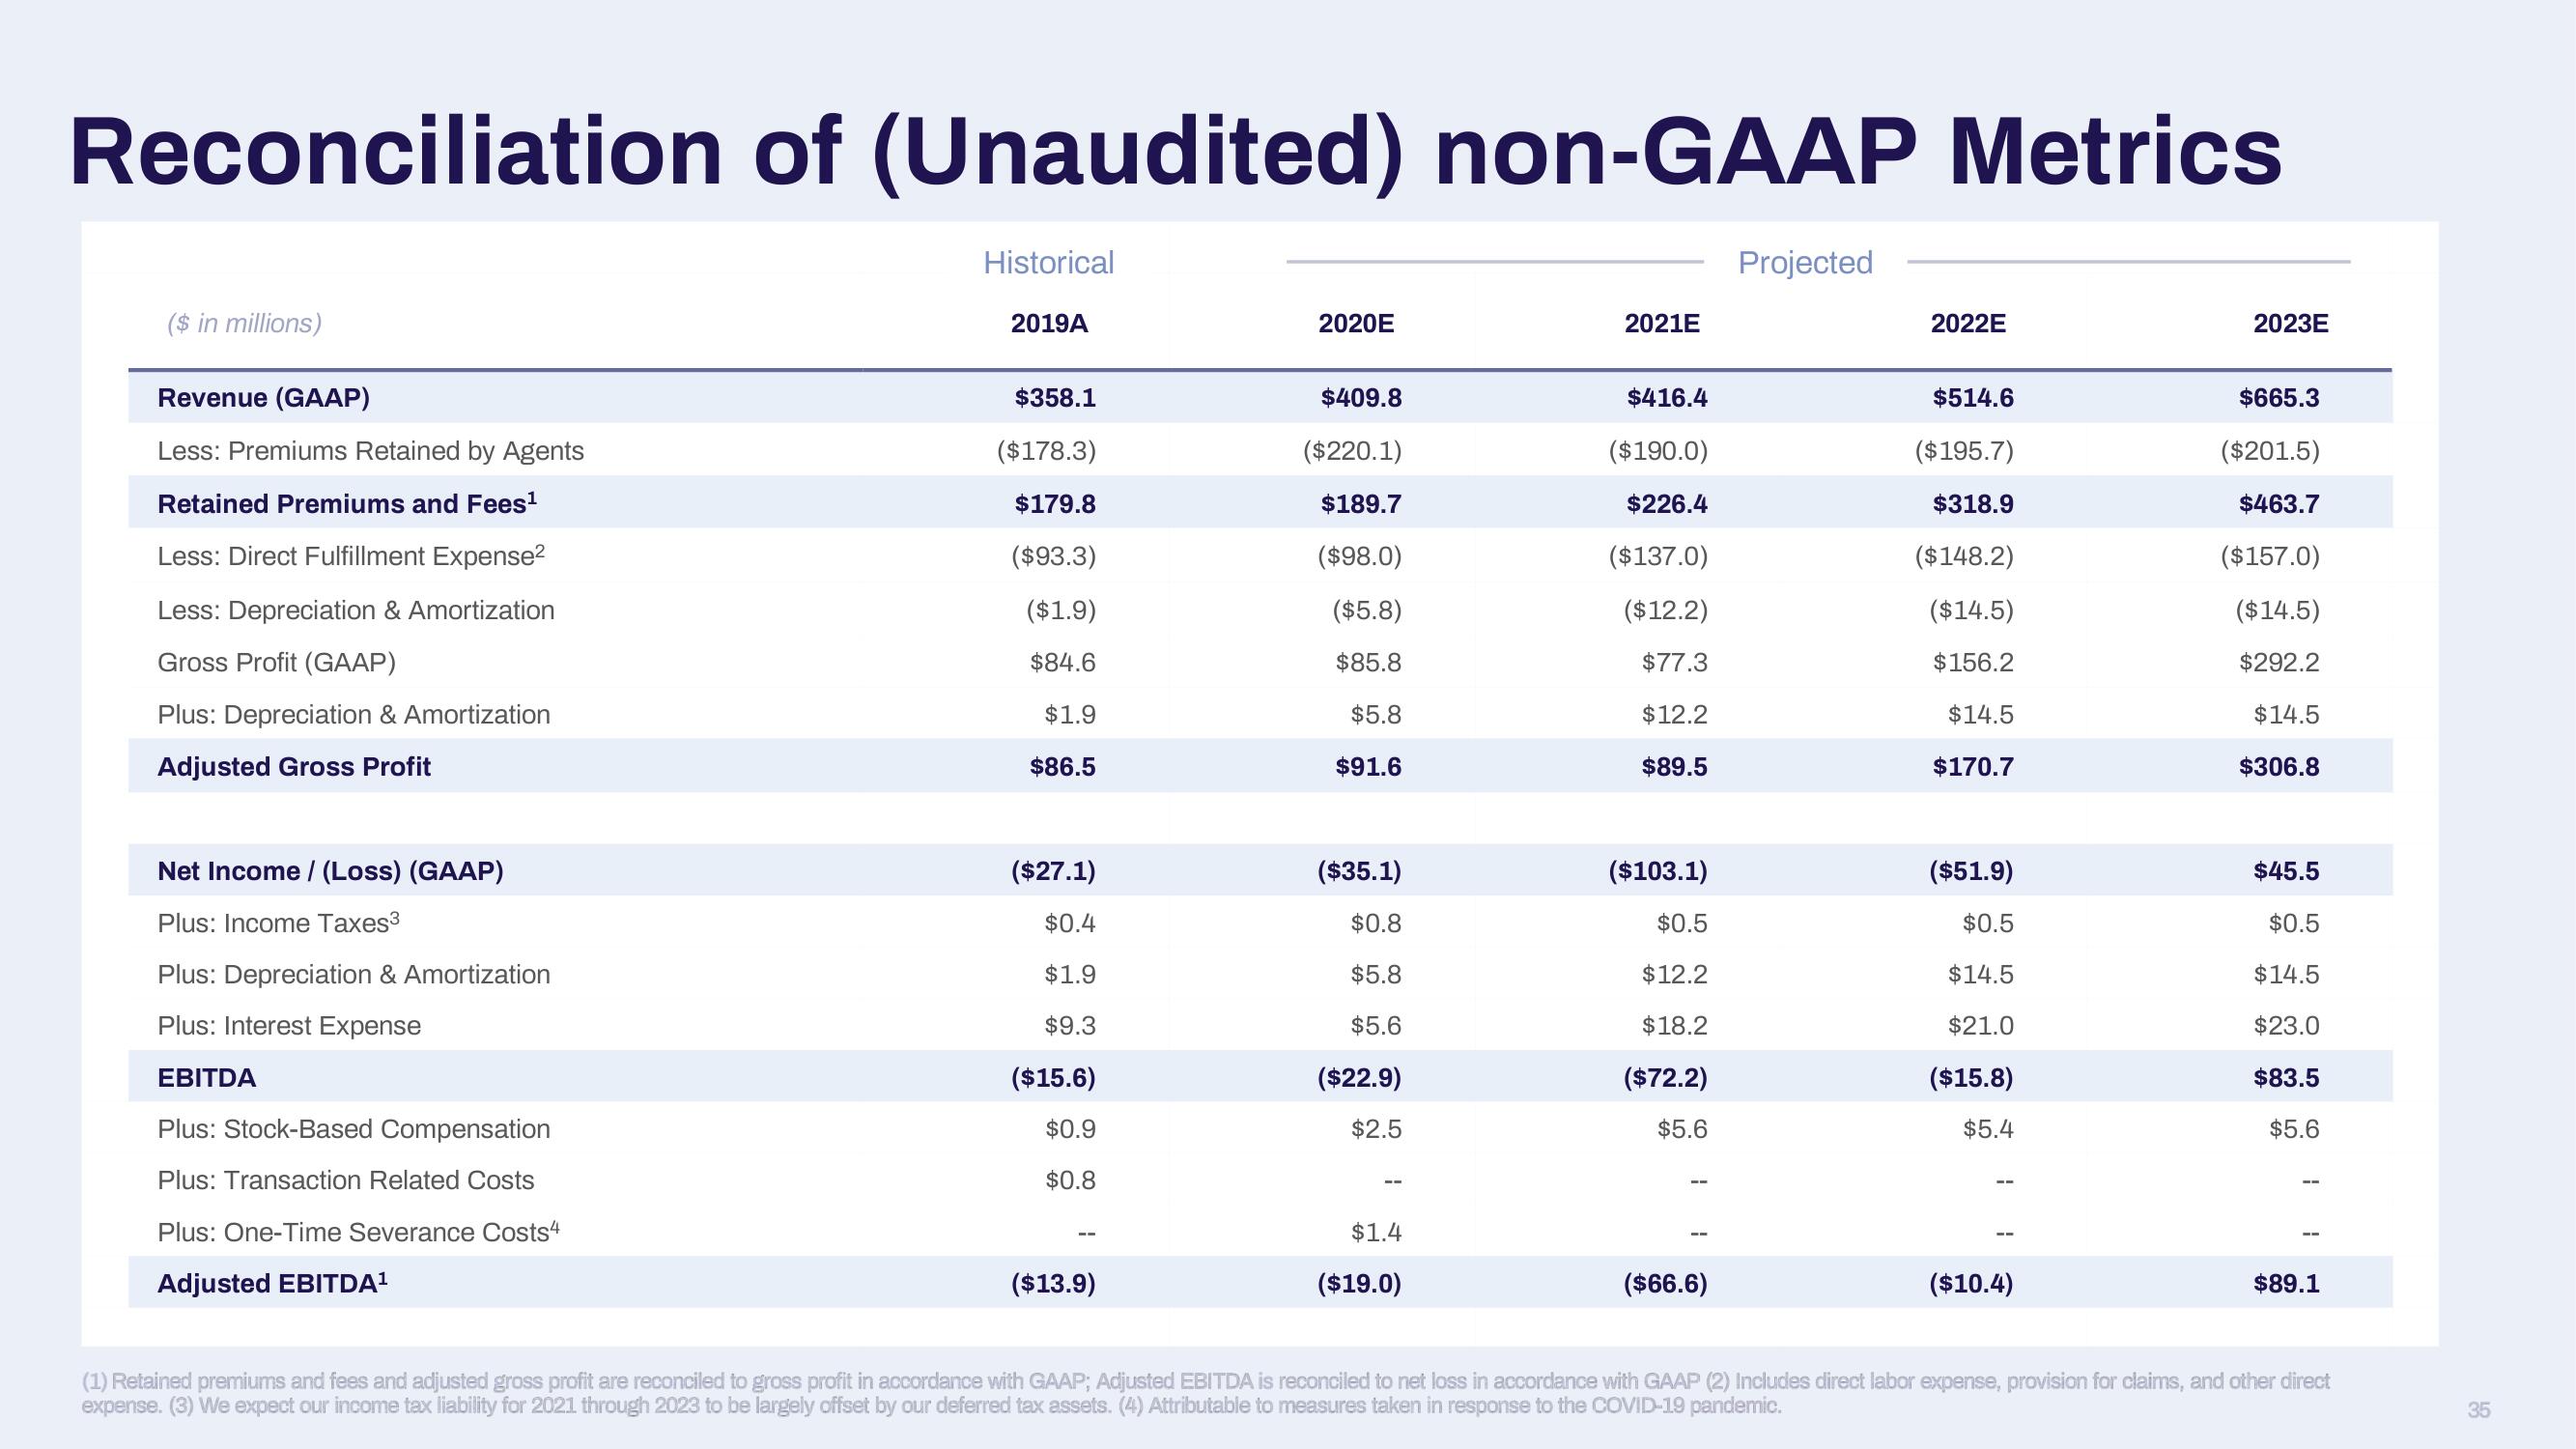
Reconciliation of (Unaudited) non-GAAP Metrics
($ in millions)
Revenue (GAAP)
Less: Premiums Retained by Agents
Retained Premiums and Fees¹
Less: Direct Fulfillment Expense²
Less: Depreciation & Amortization
Gross Profit (GAAP)
Plus: Depreciation & Amortization
Adjusted Gross Profit
Net Income / (Loss) (GAAP)
Plus: Income Taxes³
Plus: Depreciation & Amortization
Plus: Interest Expense
EBITDA
Plus: Stock-Based Compensation
Plus: Transaction Related Costs
Plus: One-Time Severance Costs4
Adjusted EBITDA¹
Historical
2019A
$358.1
($178.3)
$179.8
($93.3)
($1.9)
$84.6
$1.9
$86.5
($27.1)
$0.4
$1.9
$9.3
($15.6)
$0.9
$0.8
($13.9)
2020E
$409.8
($220.1)
$189.7
($98.0)
($5.8)
$85.8
$5.8
$91.6
($35.1)
$0.8
$5.8
$5.6
($22.9)
$2.5
==
$1.4
($19.0)
2021E
$416.4
($190.0)
$226.4
($137.0)
($12.2)
$77.3
$12.2
$89.5
($103.1)
$0.5
$12.2
$18.2
($72.2)
$5.6
($66.6)
Projected
2022E
$514.6
($195.7)
$318.9
($148.2)
($14.5)
$156.2
$14.5
$170.7
($51.9)
$0.5
$14.5
$21.0
($15.8)
$5.4
($10.4)
2023E
$665.3
($201.5)
$463.7
($157.0)
($14.5)
$292.2
$14.5
$306.8
$45.5
$0.5
$14.5
$23.0
$83.5
$5.6
--
$89.1
(1) Retained premiums and fees and adjusted gross profit are reconciled to gross profit in accordance with GAAP; Adjusted EBITDA is reconciled to net loss in accordance with GAAP (2) Includes direct labor expense, provision for claims, and other direct
expense. (3) We expect our income tax liability for 2021 through 2023 to be largely offset by our deferred tax assets. (4) Attributable to measures taken in response to the COVID-19 pandemic.
35View entire presentation