Sisecam Resources Investor Presentation Deck
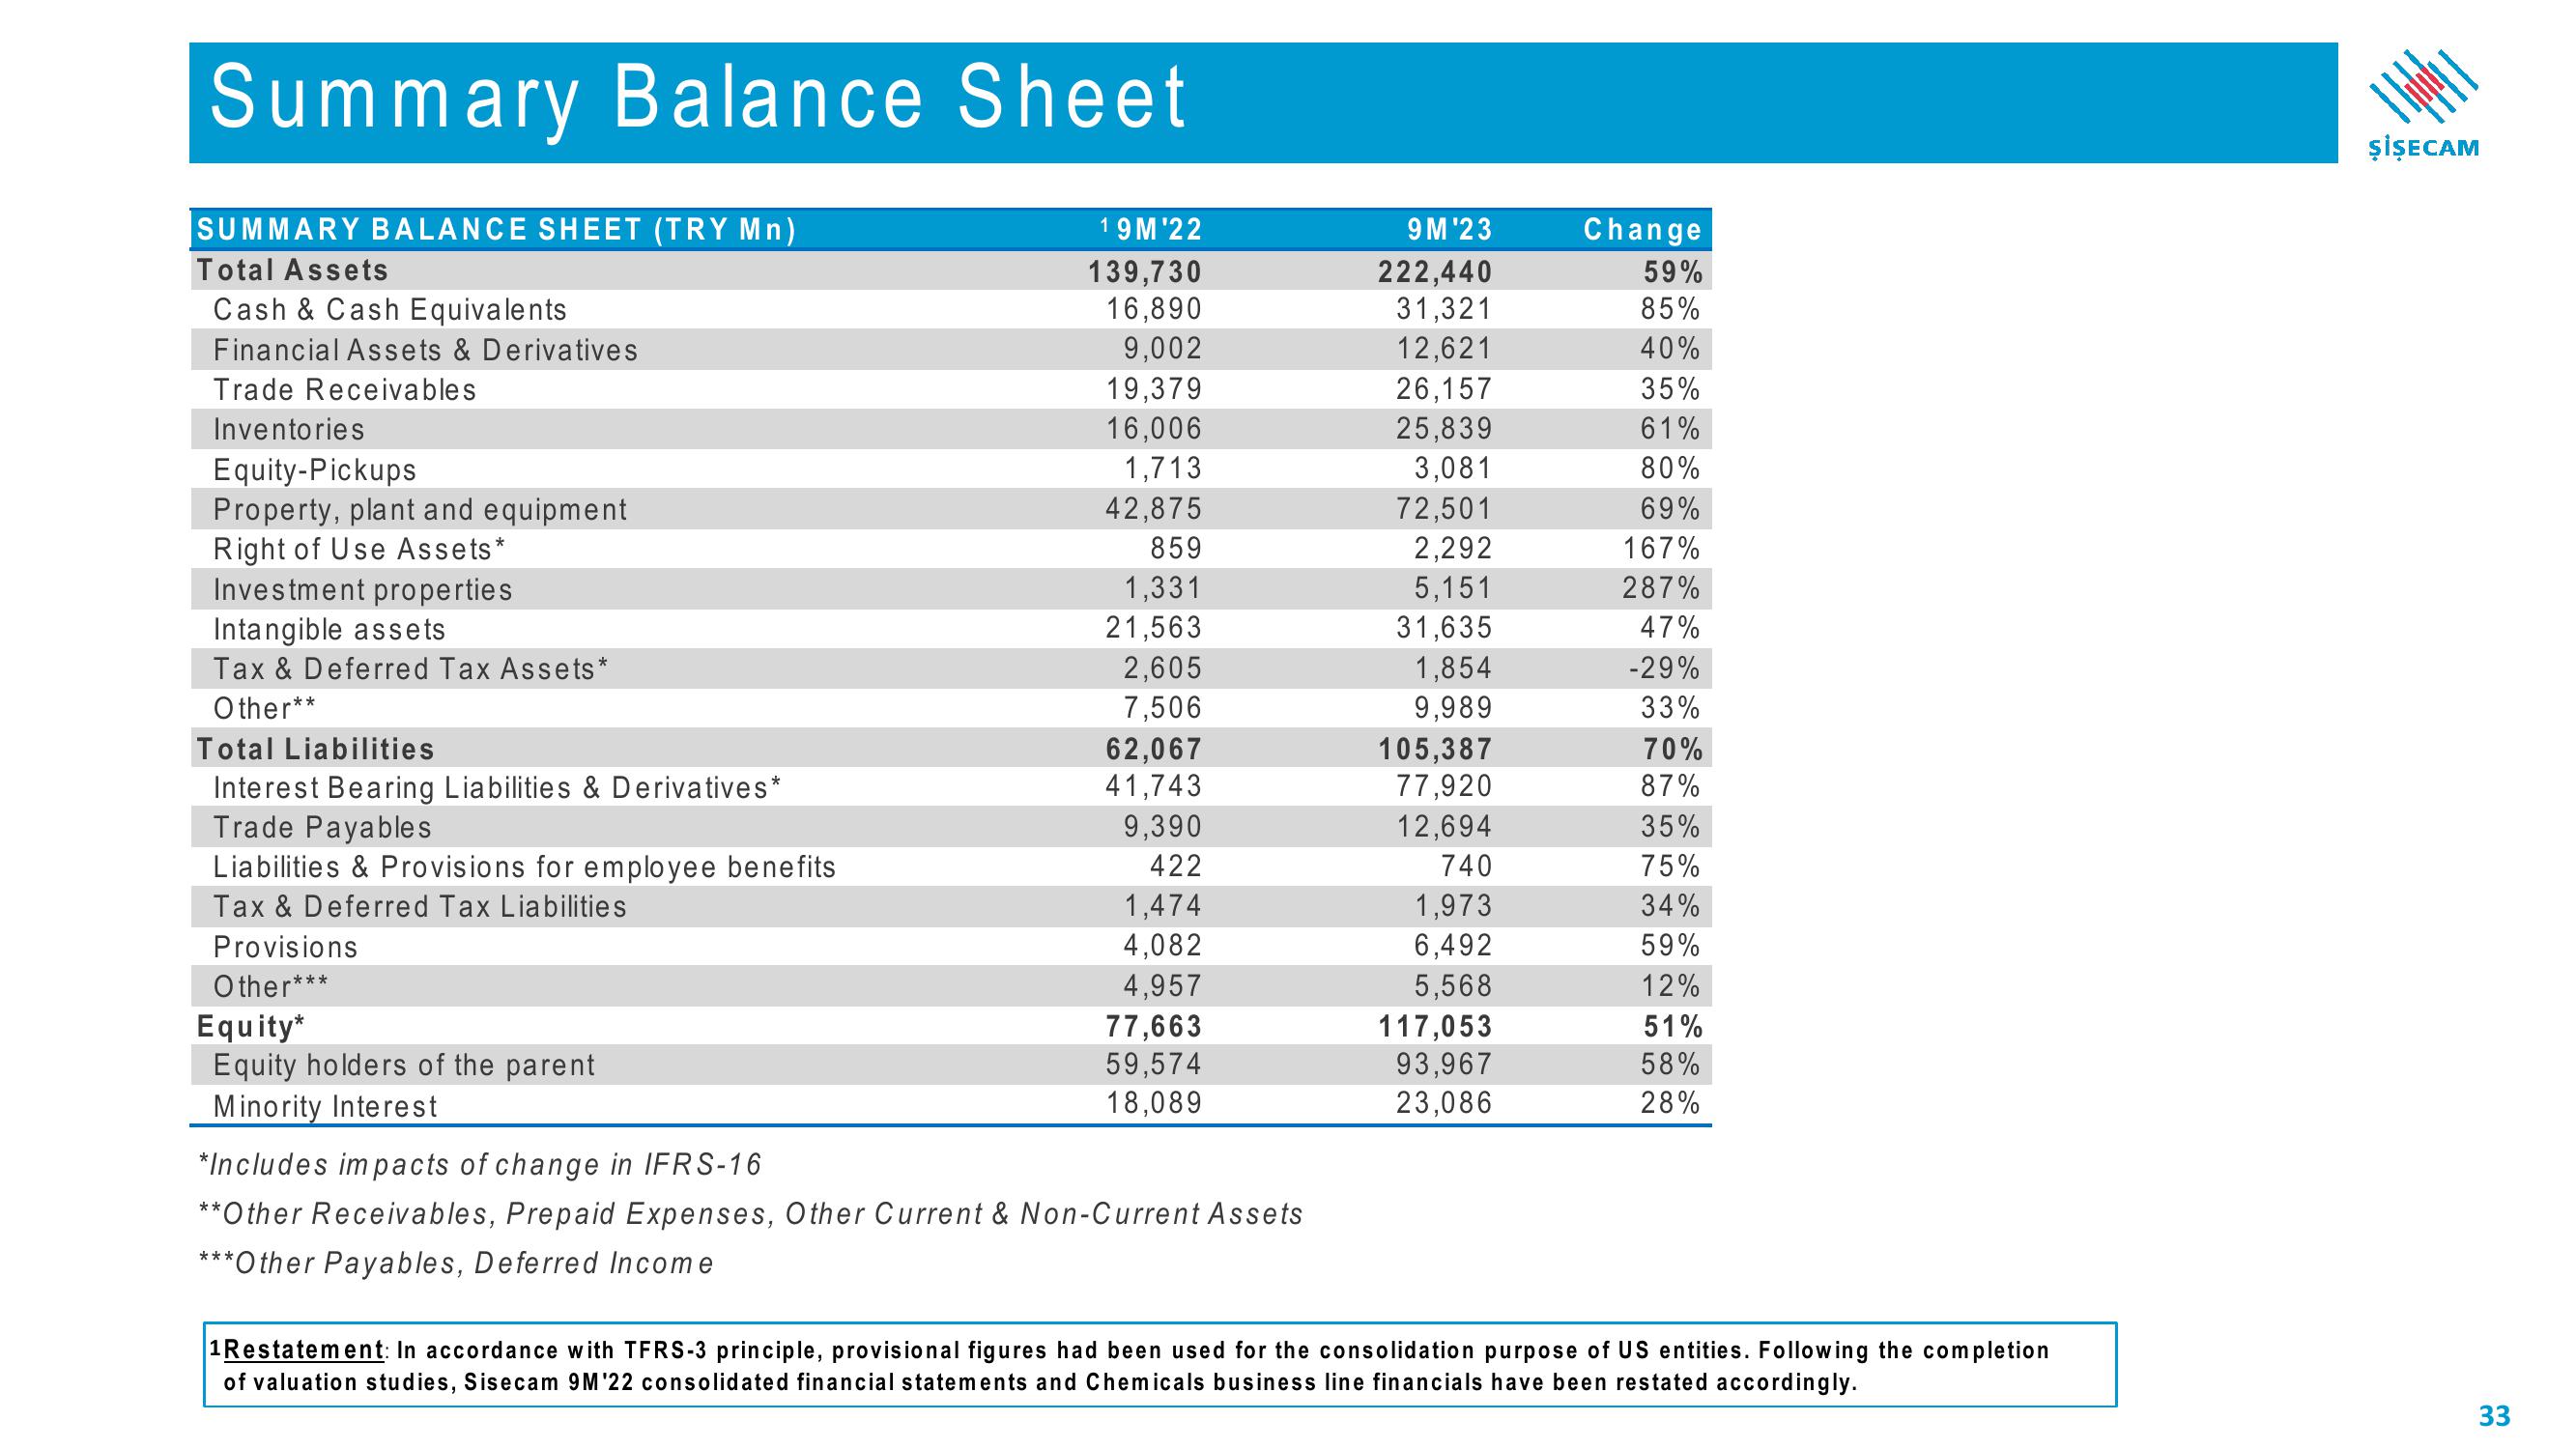
Summary Balance Sheet
SUMMARY BALANCE SHEET (TRY Mn)
Total Assets
Cash & Cash Equivalents
Financial Assets & Derivatives
Trade Receivables
Inventories
Equity-Pickups
Property, plant and equipment
Right of Use Assets*
Investment properties
Intangible assets
Tax & Deferred Tax Assets*
Other**
Total Liabilities
Interest Bearing Liabilities & Derivatives*
Trade Payables
Liabilities & Provisions for employee benefits
Tax & Deferred Tax Liabilities
Provisions
Other***
Equity*
Equity holders of the parent
Minority Interest
19M¹22
139,730
16,890
9,002
19,379
16,006
1,713
42,875
859
1,331
21,563
2,605
7,506
62,067
41,743
9,390
422
1,474
4,082
4,957
77,663
59,574
18,089
*Includes impacts of change in IFRS-16
**Other Receivables, Prepaid Expenses, Other Current & Non-Current Assets
***Other Payables, Deferred Income
9M¹23
222,440
31,321
12,621
26,157
25,839
3,081
72,501
2,292
5,151
31,635
1,854
9,989
105,387
77,920
12,694
740
1,973
6,492
5,568
117,053
93,967
23,086
Change
59%
85%
40%
35%
61%
80%
69%
167%
287%
47%
-29%
33%
70%
87%
35%
75%
34%
59%
12%
51%
58%
28%
1Restatement: In accordance with TFRS-3 principle, provisional figures had been used for the consolidation purpose of US entities. Following the completion
of valuation studies, Sisecam 9M¹22 consolidated financial statements and Chemicals business line financials have been restated accordingly.
|||||
ŞİŞECAM
33View entire presentation