Avantor Results Presentation Deck
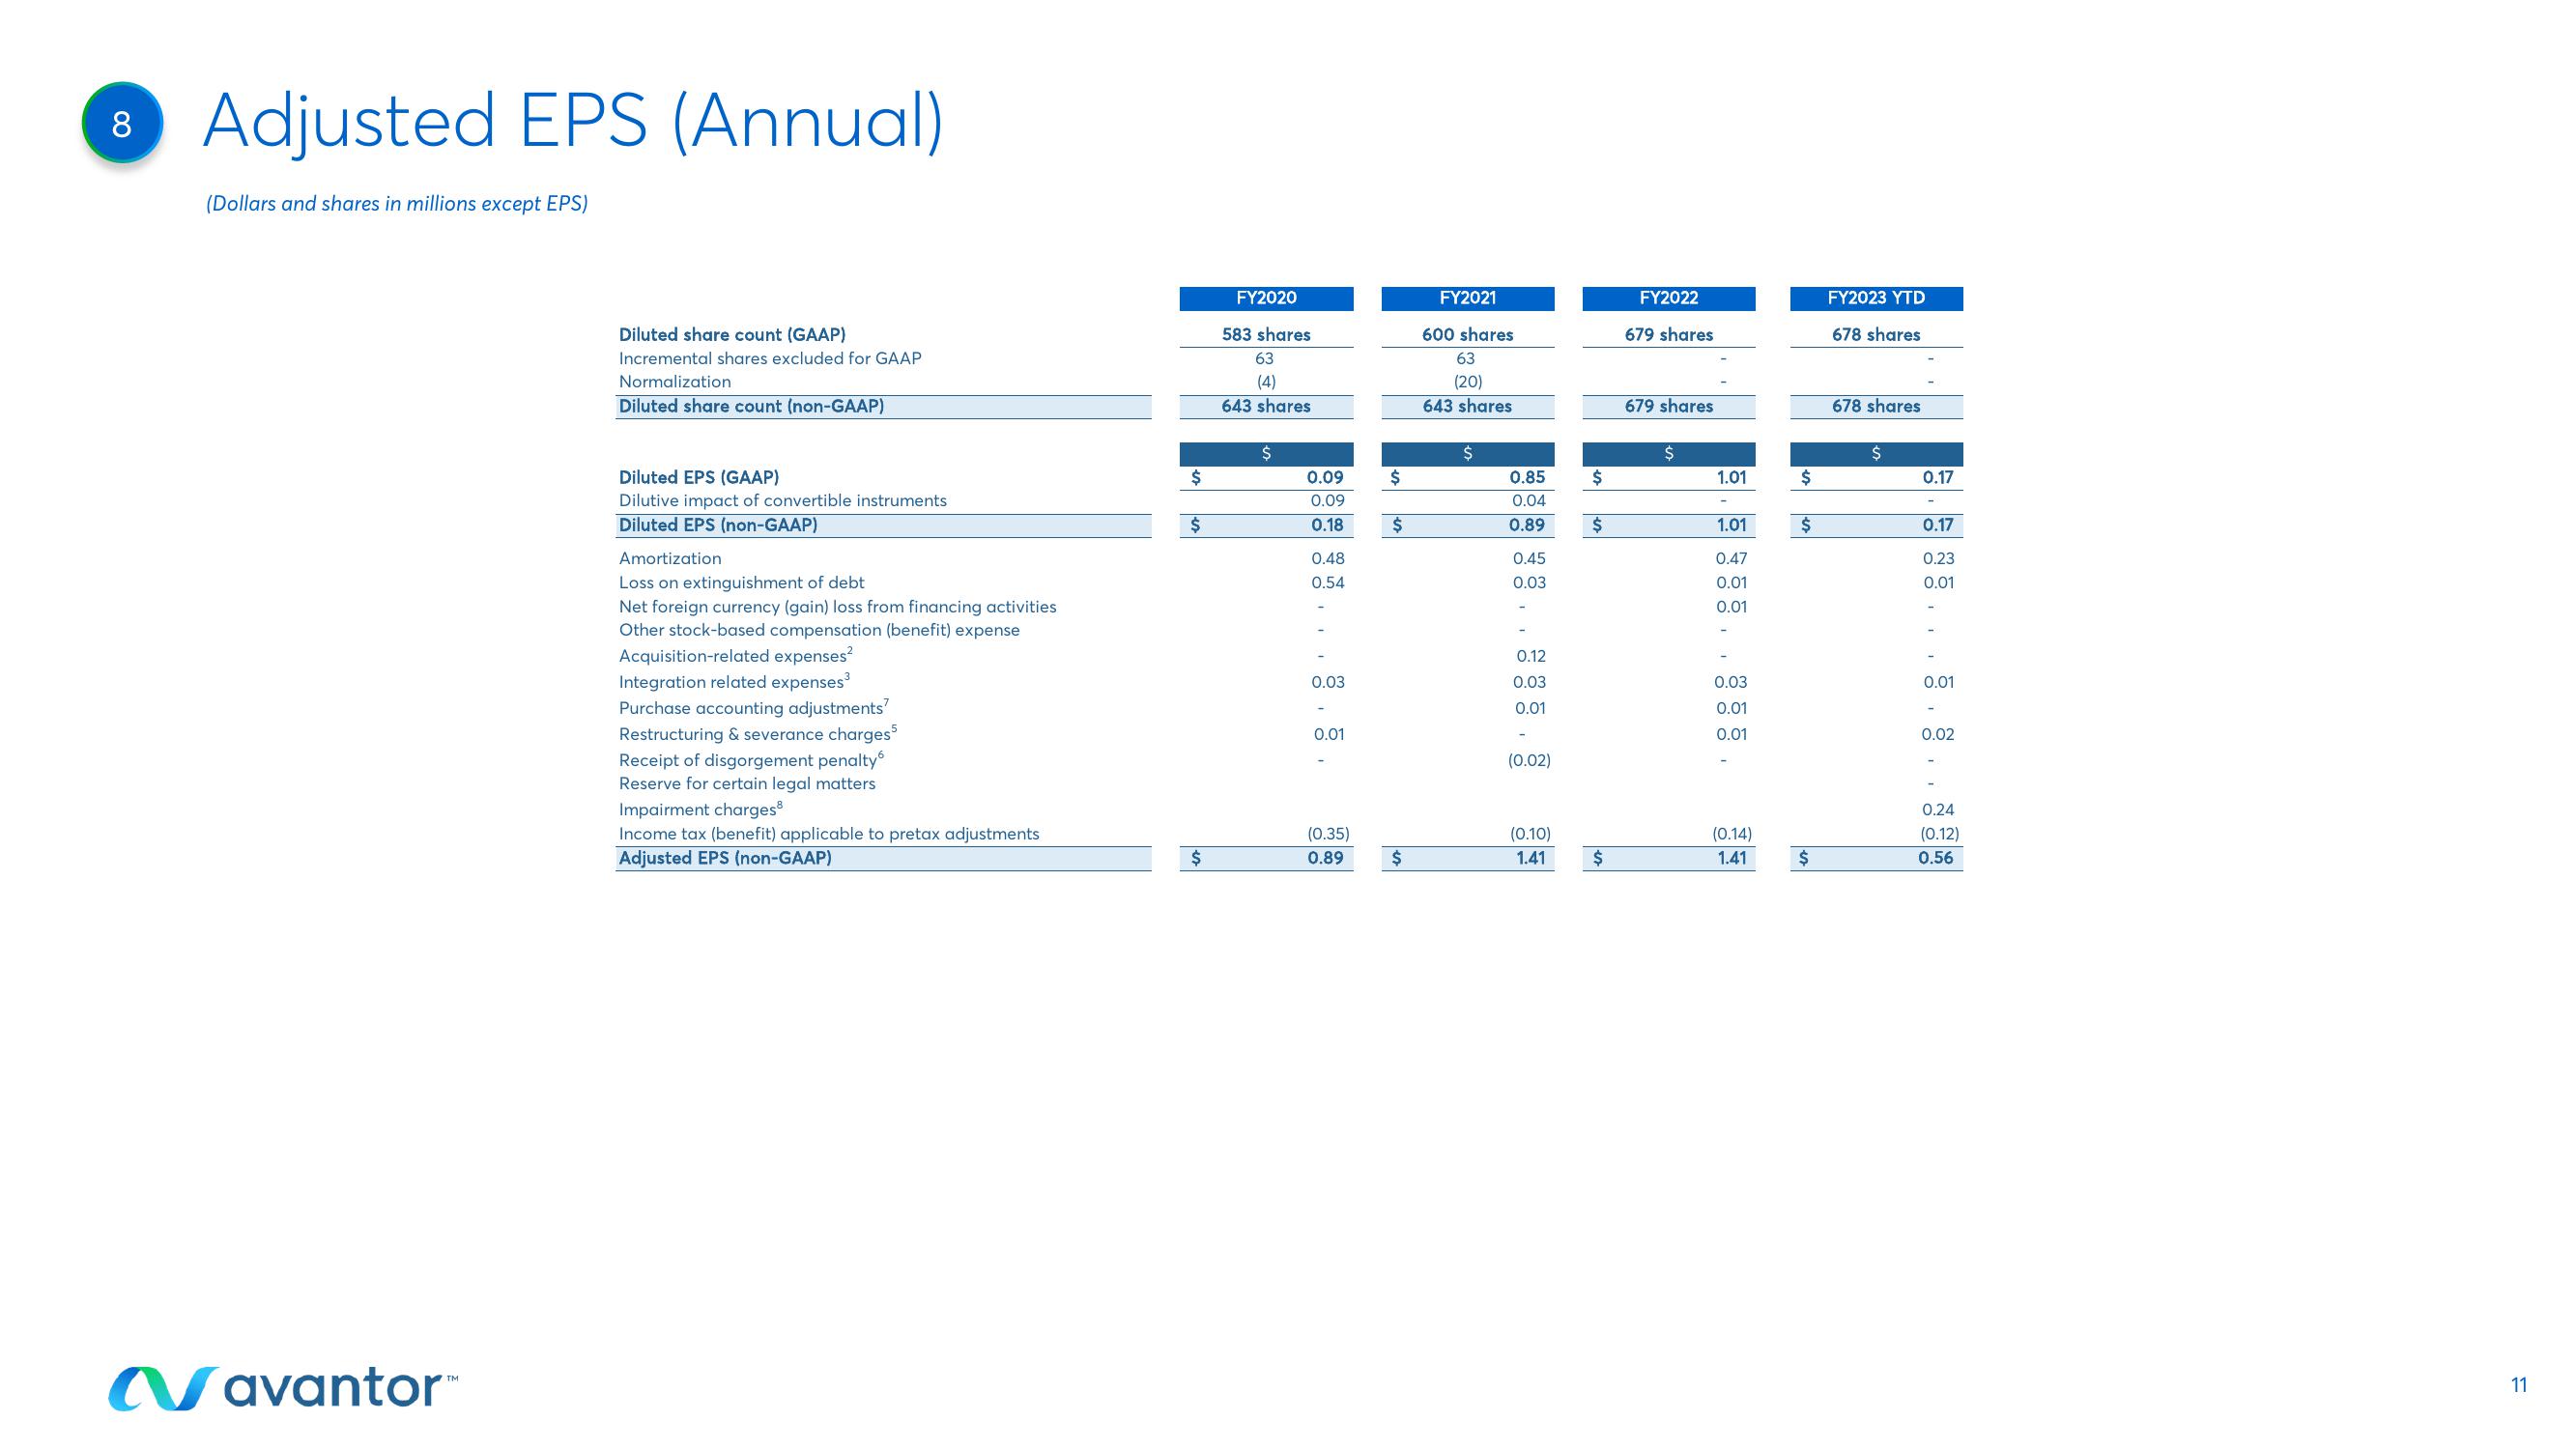
8 Adjusted EPS (Annual)
(Dollars and shares in millions except EPS)
Navantor™
Diluted share count (GAAP)
Incremental shares excluded for GAAP
Normalization
Diluted share count (non-GAAP)
Diluted EPS (GAAP)
Dilutive impact of convertible instruments
Diluted EPS (non-GAAP)
Amortization
Loss on extinguishment of debt
Net foreign currency (gain) loss from financing activities
Other stock-based compensation (benefit) expense
Acquisition-related expenses²
Integration related expenses³
Purchase accounting adjustments?
Restructuring & severance charges5
Receipt of disgorgement penalty
Reserve for certain legal matters
Impairment charges
Income tax (benefit) applicable to pretax adjustments
Adjusted EPS (non-GAAP)
$
$
val
$
FY2020
583 shares
63
(4)
643 shares
$
0.09
0.09
0.18
0.48
0.54
0.03
0.01
(0.35)
0.89
$
$
$
FY2021
600 shares
63
(20)
643 shares
$
0.85
0.04
0.89
0.45
0.03
:
0.12
0.03
0.01
(0.02)
(0.10)
1.41
$
$
$
FY2022
679 shares
679 shares
$
1.01
1.01
0.47
0.01
0.01
0.03
0.01
0.01
(0.14)
1.41
$
$
$
FY2023 YTD
678 shares
678 shares
$
0.17
0.17
0.23
0.01
0.01
0.02
0.24
(0.12)
0.56
11View entire presentation