OpenText Investor Presentation Deck
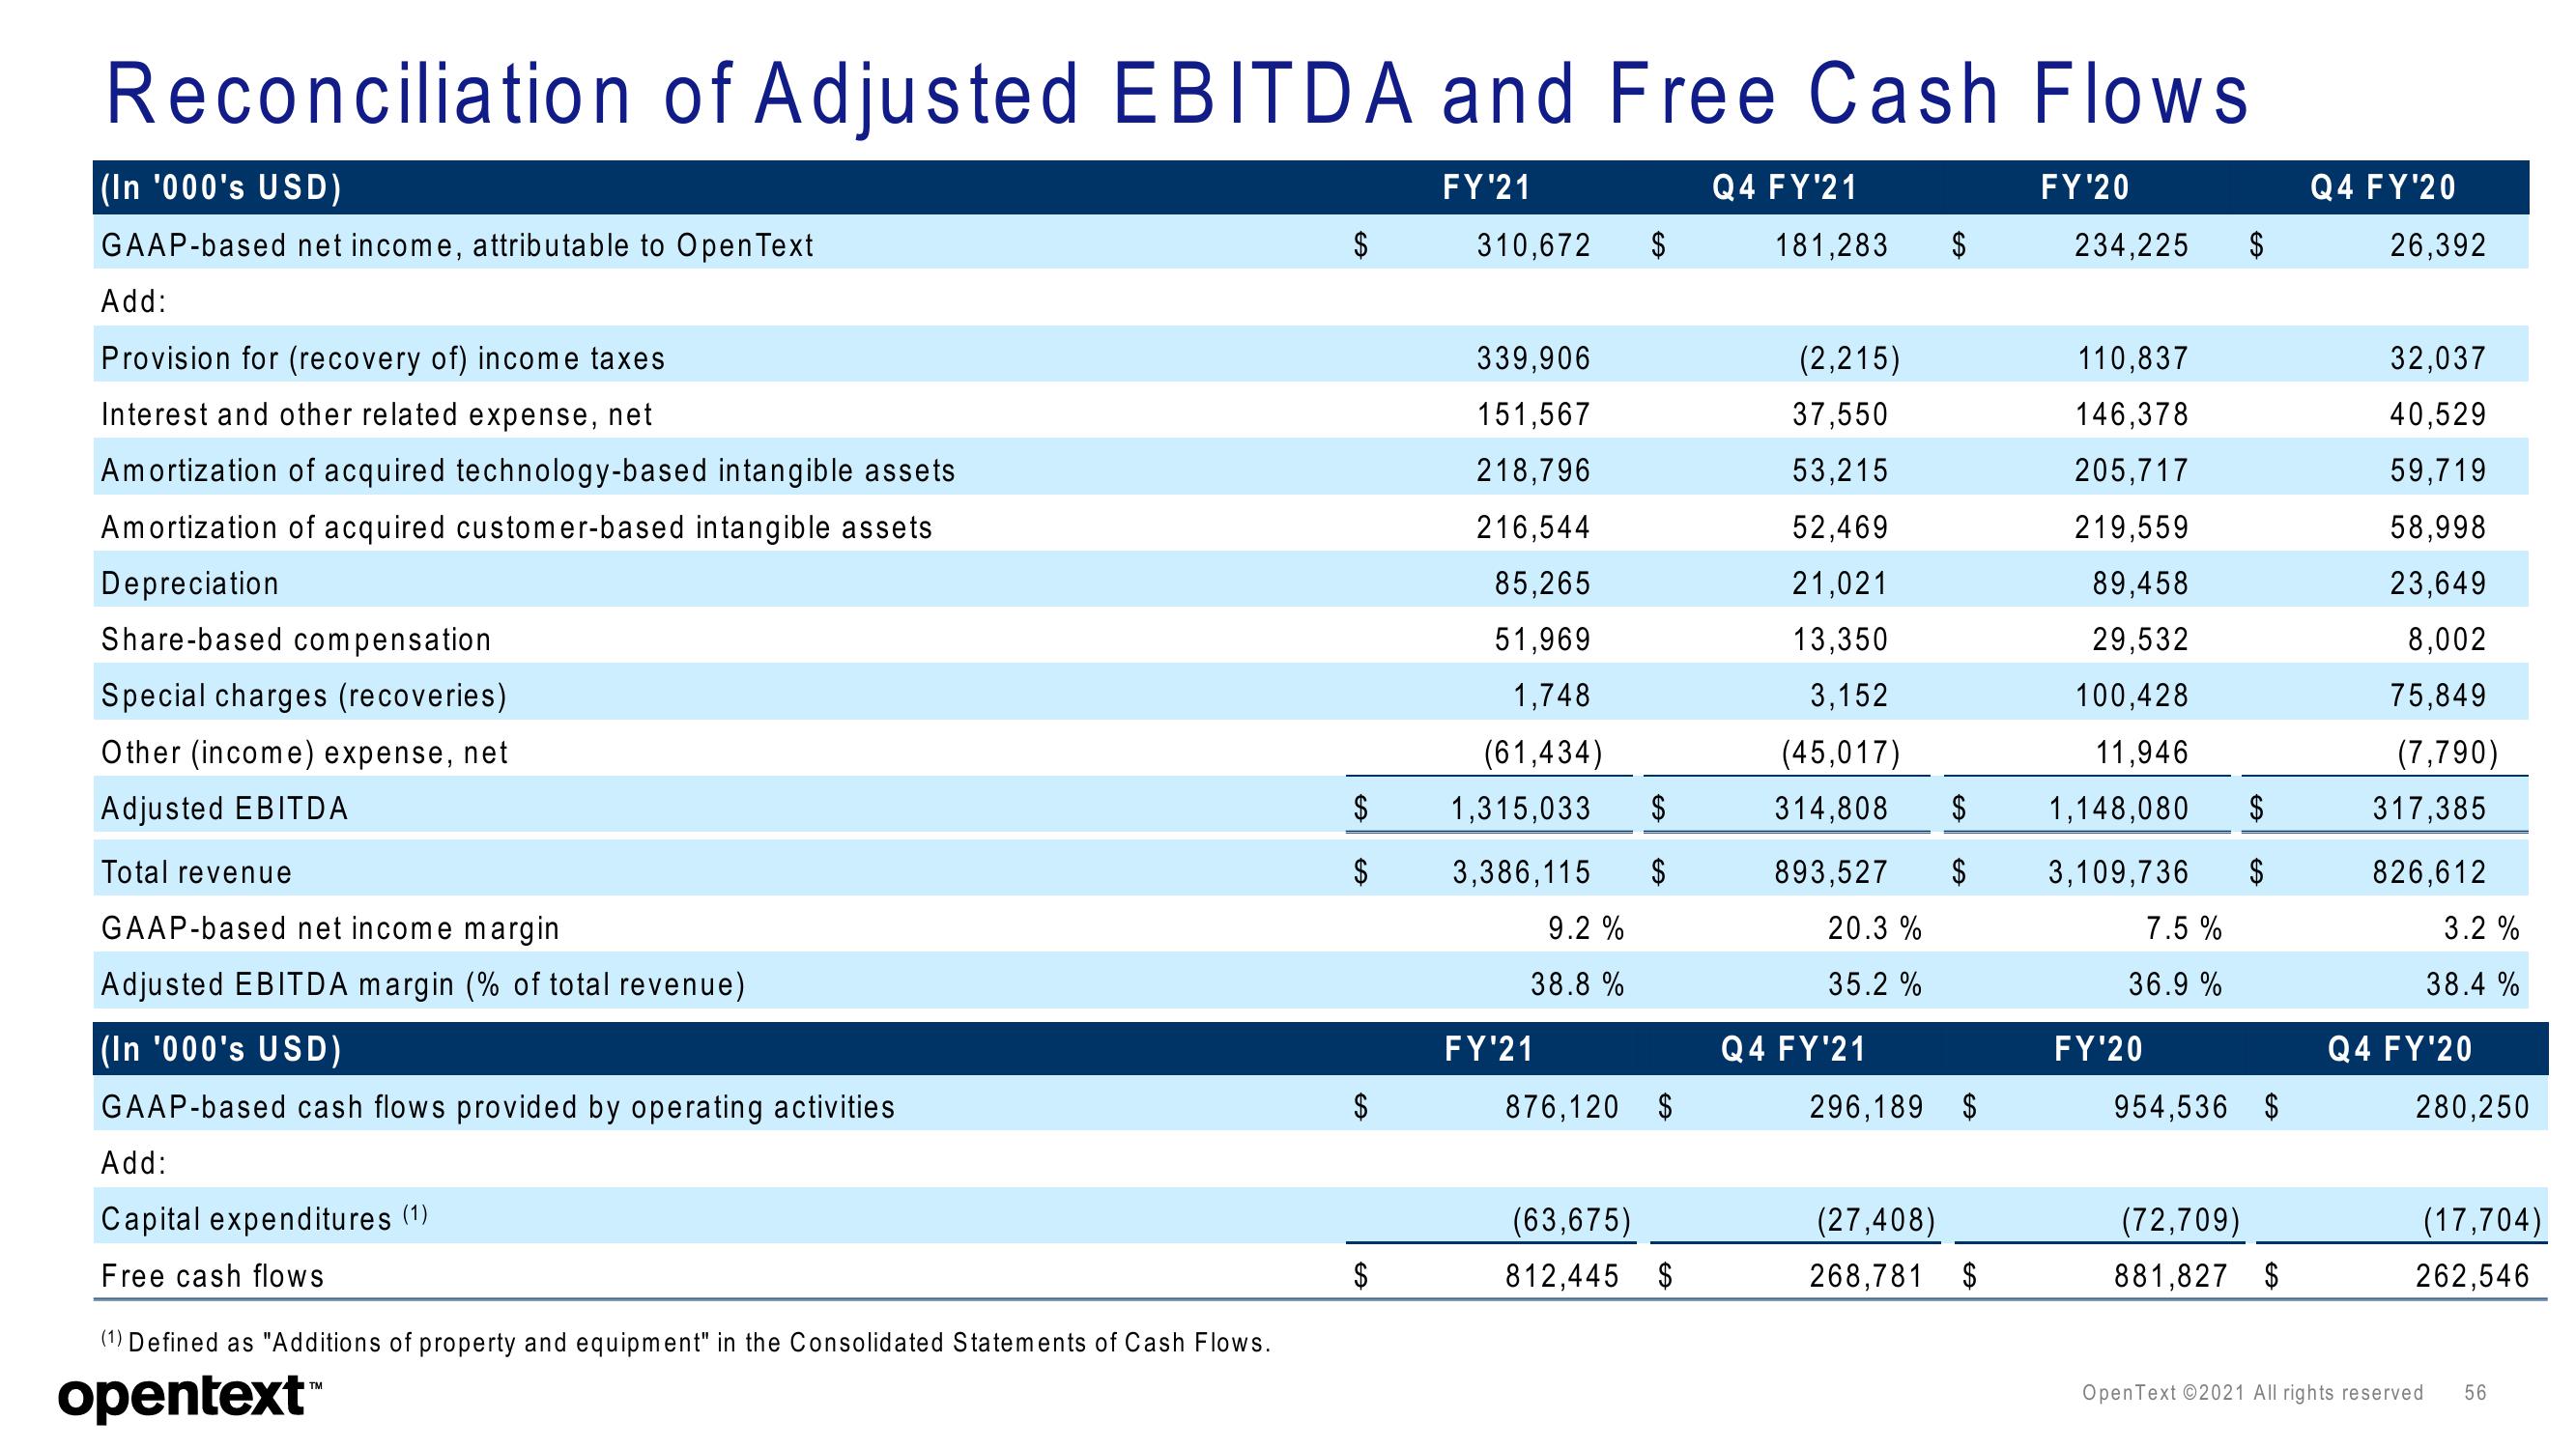
Reconciliation of Adjusted EBITDA and Free Cash Flows
FY'21
(In '000's USD)
GAAP-based net income, attributable to Open Text
Add:
Provision for (recovery of) income taxes
Interest and other related expense, net
Amortization of acquired technology-based intangible assets
Amortization of acquired customer-based intangible assets
Depreciation
Share-based compensation
Special charges (recoveries)
Other (income) expense, net
Adjusted EBITDA
Total revenue
GAAP-based net income margin
Adjusted EBITDA margin (% of total revenue)
(In '000's USD)
GAAP-based cash flows provided by operating activities
Add:
Capital expenditures (1)
Free cash flows
(1) Defined as "Additions of property and equipment" in the Consolidated Statements of Cash Flows.
opentext™
$
339,906
151,567
218,796
216,544
85,265
51,969
1,748
(61,434)
$ 1,315,033
$
3,386,115
SA
310,672
$
FY'21
9.2%
38.8%
$
SA
876,120 $
(63,675)
812,445 $
Q4 FY'21
181,283
(2,215)
37,550
53,215
$
52,469
21,021
13,350
3,152
(45,017)
314,808 $
893,527 $
20.3%
35.2 %
Q4 FY'21
296,189 $
(27,408)
268,781 $
FY'20
234,225 $
110,837
146,378
205,717
219,559
89,458
29,532
100,428
11,946
1,148,080 $
3,109,736 $
7.5%
36.9%
FY'20
954,536 $
(72,709)
881,827 $
Q4 FY'20
26,392
32,037
40,529
59,719
58,998
23,649
8,002
75,849
(7,790)
317,385
826,612
3.2%
38.4 %
Q4 FY'20
280,250
(17,704)
262,546
Open Text ©2021 All rights reserved
56View entire presentation