LionTree Investment Banking Pitch Book
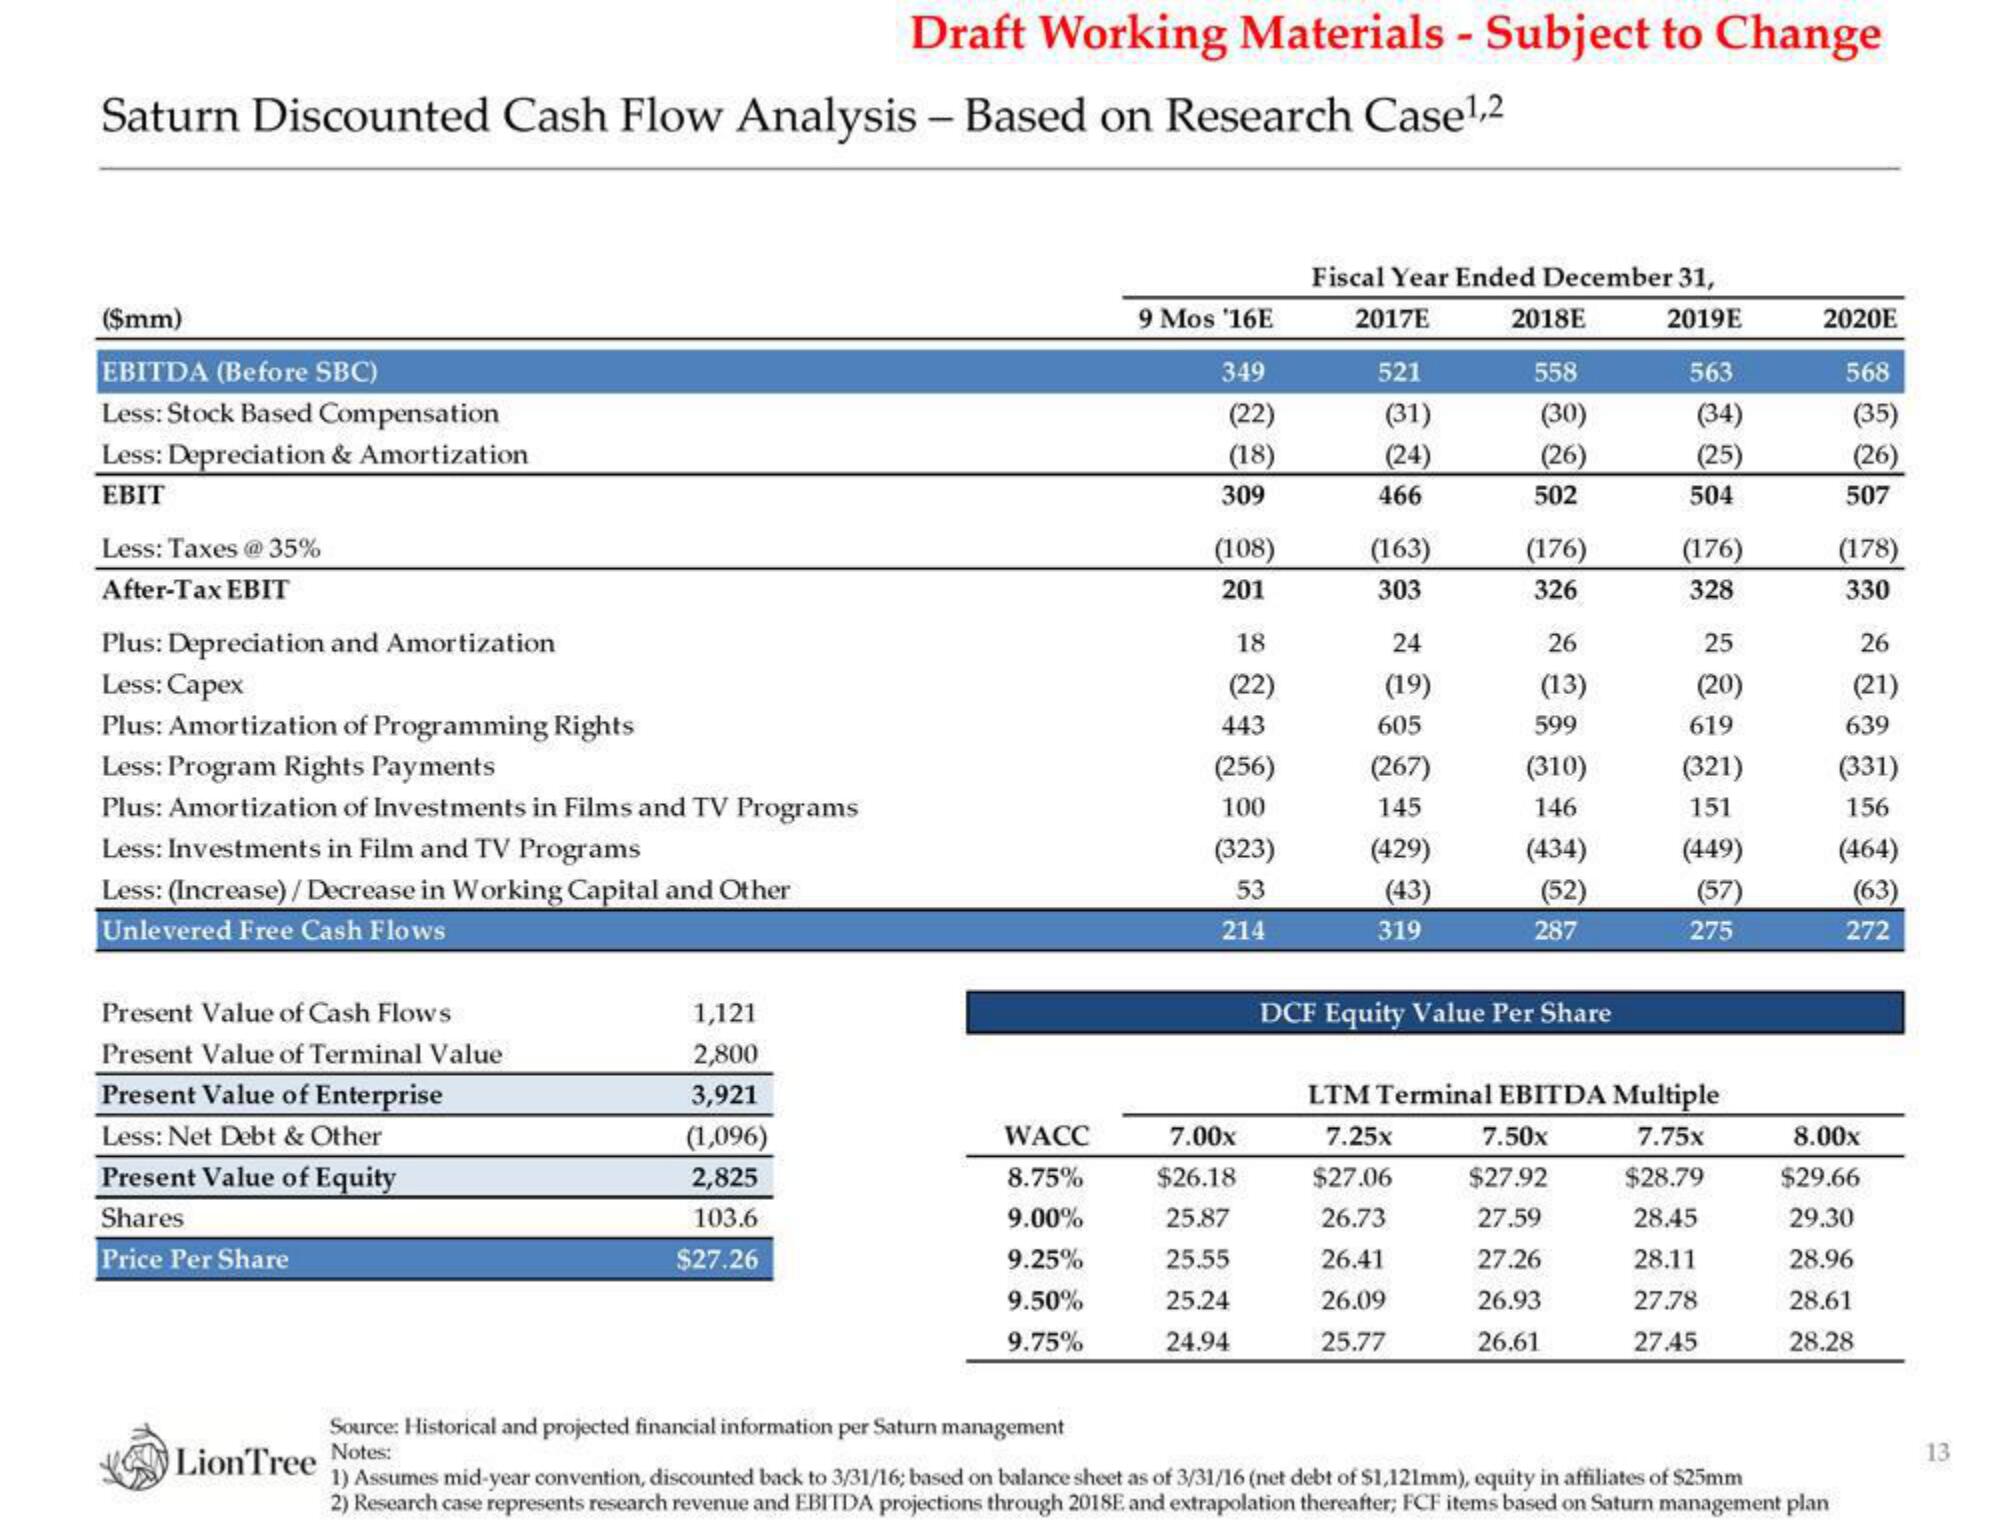
Saturn Discounted Cash Flow Analysis - Based on Research Case¹,2
($mm)
EBITDA (Before SBC)
Less: Stock Based Compensation
Less: Depreciation & Amortization
EBIT
Less: Taxes @ 35%
After-Tax EBIT
Plus: Depreciation and Amortization
Less: Capex
Plus: Amortization of Programming Rights
Less: Program Rights Payments
Plus: Amortization of Investments in Films and TV Programs
Less: Investments in Film and TV Programs
Less: (Increase) /Decrease in Working Capital and Other
Unlevered Free Cash Flows
Present Value of Cash Flows
Present Value of Terminal Value
Present Value of Enterprise
Less: Net Debt & Other
Present Value of Equity
Shares
Price Per Share
Draft Working Materials - Subject to Change
1,121
2,800
3,921
(1,096)
2,825
103.6
$27.26
LionTree Notes:
WACC
8.75%
9.00%
9.25%
9.50%
9.75%
Source: Historical and projected financial information per Saturn management
9 Mos '16E
349
(22)
(18)
309
(108)
201
18
(22)
443
(256)
100
(323)
53
214
7.00x
$26.18
25.87
25.55
25.24
24.94
Fiscal Year Ended December 31,
2017E
2019E
521
(31)
(24)
466
(163)
303
24
(19)
605
(267)
145
(429)
(43)
319
2018E
558
(30)
(26)
7.25x
$27.06
26.73
26.41
26.09
25.77
502
(176)
326
26
(13)
599
(310)
146
(434)
(52)
287
DCF Equity Value Per Share
563
7.50x
$27.92
27.59
27.26
26.93
26.61
(34)
(25)
504
(176)
328
25
(20)
619
(321)
151
(449)
(57)
LTM Terminal EBITDA Multiple
7.75x
$28.79
28.45
28.11
27.78
27.45
275
2020E
568
(35)
(26)
1) Assumes mid-year convention, discounted back to 3/31/16; based on balance sheet as of 3/31/16 (net debt of $1,121mm), equity in affiliates of $25mm
2) Research case represents research revenue and EBITDA projections through 2018E and extrapolation thereafter; FCF items based on Saturn management plan
507
(178)
330
26
(21)
639
(331)
156
(464)
(63)
272
8.00x
$29.66
29.30
28.96
28.61
28.28
13View entire presentation