Vale Investor Day Presentation Deck
The equity story for Vale
A robust cash flow generation and a disciplined capital allocation
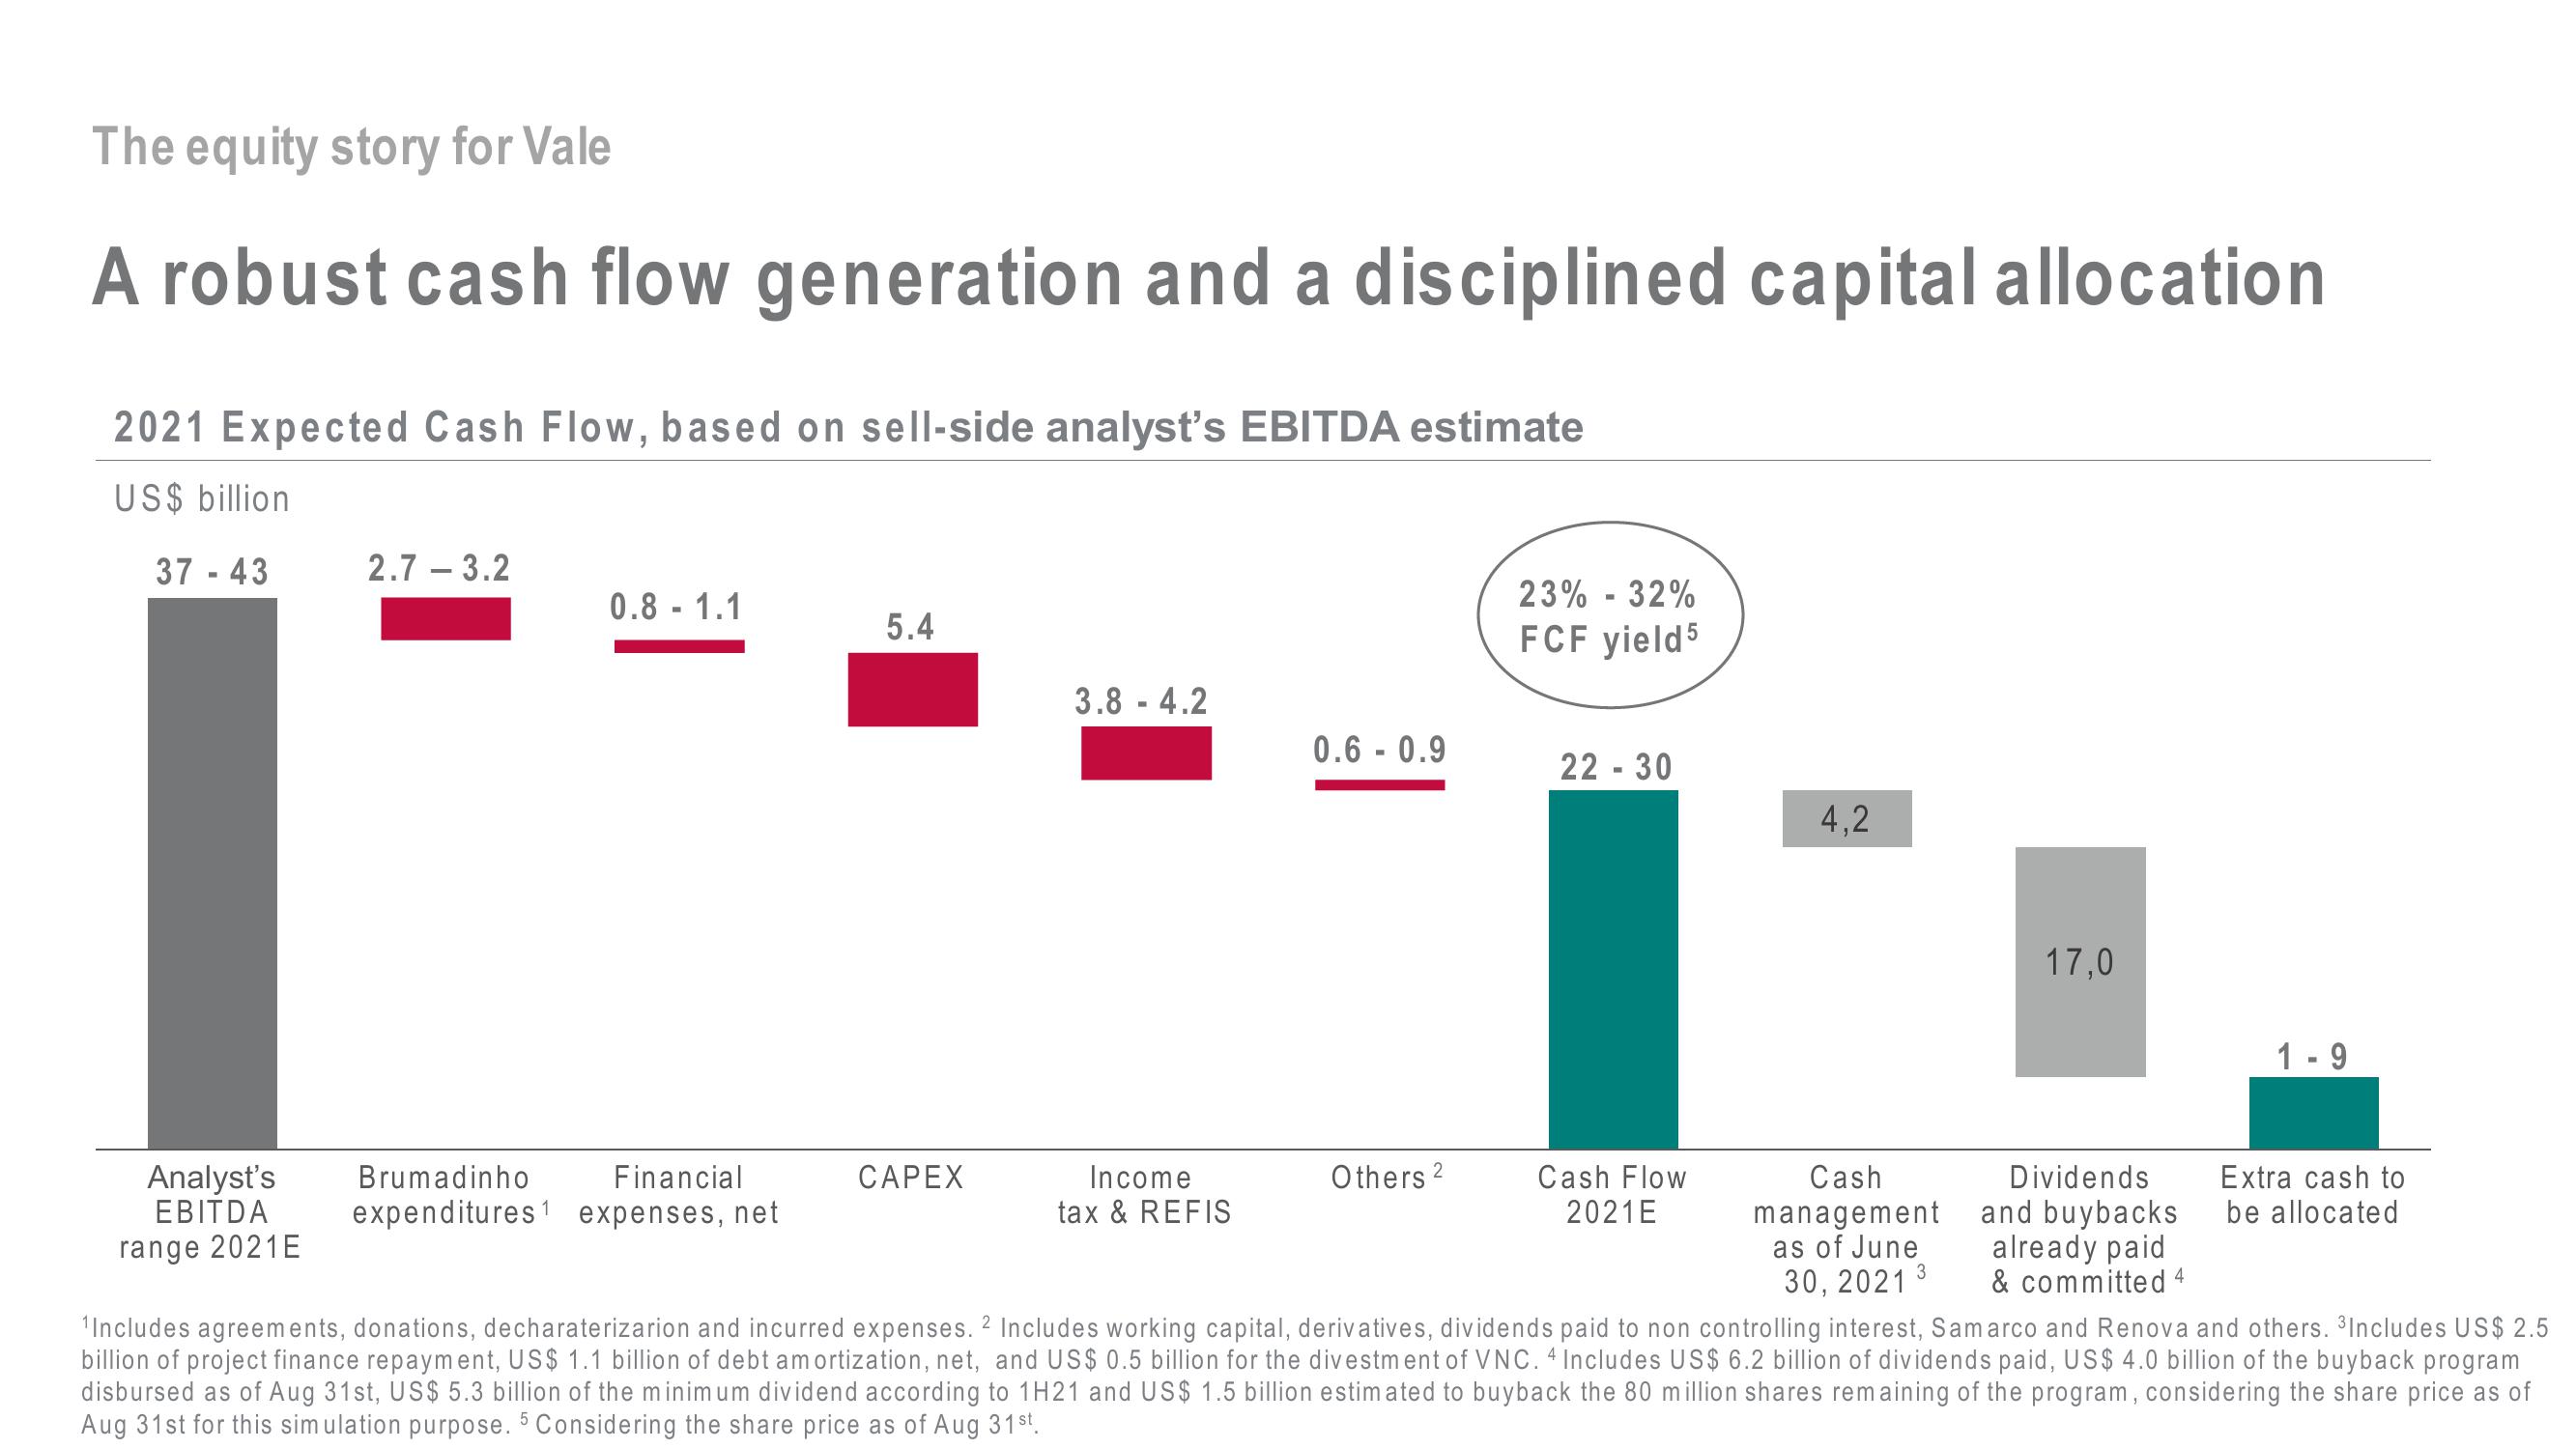
2021 Expected Cash Flow, based on sell-side analyst's EBITDA estimate
US$ billion
37 - 43
2.7-3.2
Analyst's
EBITDA
range 2021E
0.8-1.1
5.4
Brumadinho
Financial
expenditures1 expenses, net
3.8-4.2
CAPEX
0.6 - 0.9
Income
tax & REFIS
23% -32%
FCF yield 5
Others 2
Dividends
and buybacks
already paid
& committed 4
¹Includes agreements, donations, decharaterizarion and incurred expenses. 2 Includes working capital, derivatives, dividends paid to non controlling interest, Samarco and Renova and others. Includes US$ 2.5
billion of project finance repayment, US$ 1.1 billion of debt amortization, net, and US$ 0.5 billion for the divestment of VNC. 4 Includes US$ 6.2 billion of dividends paid, US$ 4.0 billion of the buyback program
disbursed as of Aug 31st, US$ 5.3 billion of the minimum dividend according to 1H21 and US$ 1.5 billion estimated to buyback the 80 million shares remaining of the program, considering the share price as of
Aug 31st for this simulation purpose. 5 Considering the share price as of Aug 31st.
22 - 30
4,2
Cash Flow
2021E
17.0
Cash
management
as of June
30, 2021 3
1-9
Extra cash to
be allocatedView entire presentation