Appreciate SPAC Presentation Deck
BUSINESS COMBINATION OVERVIEW
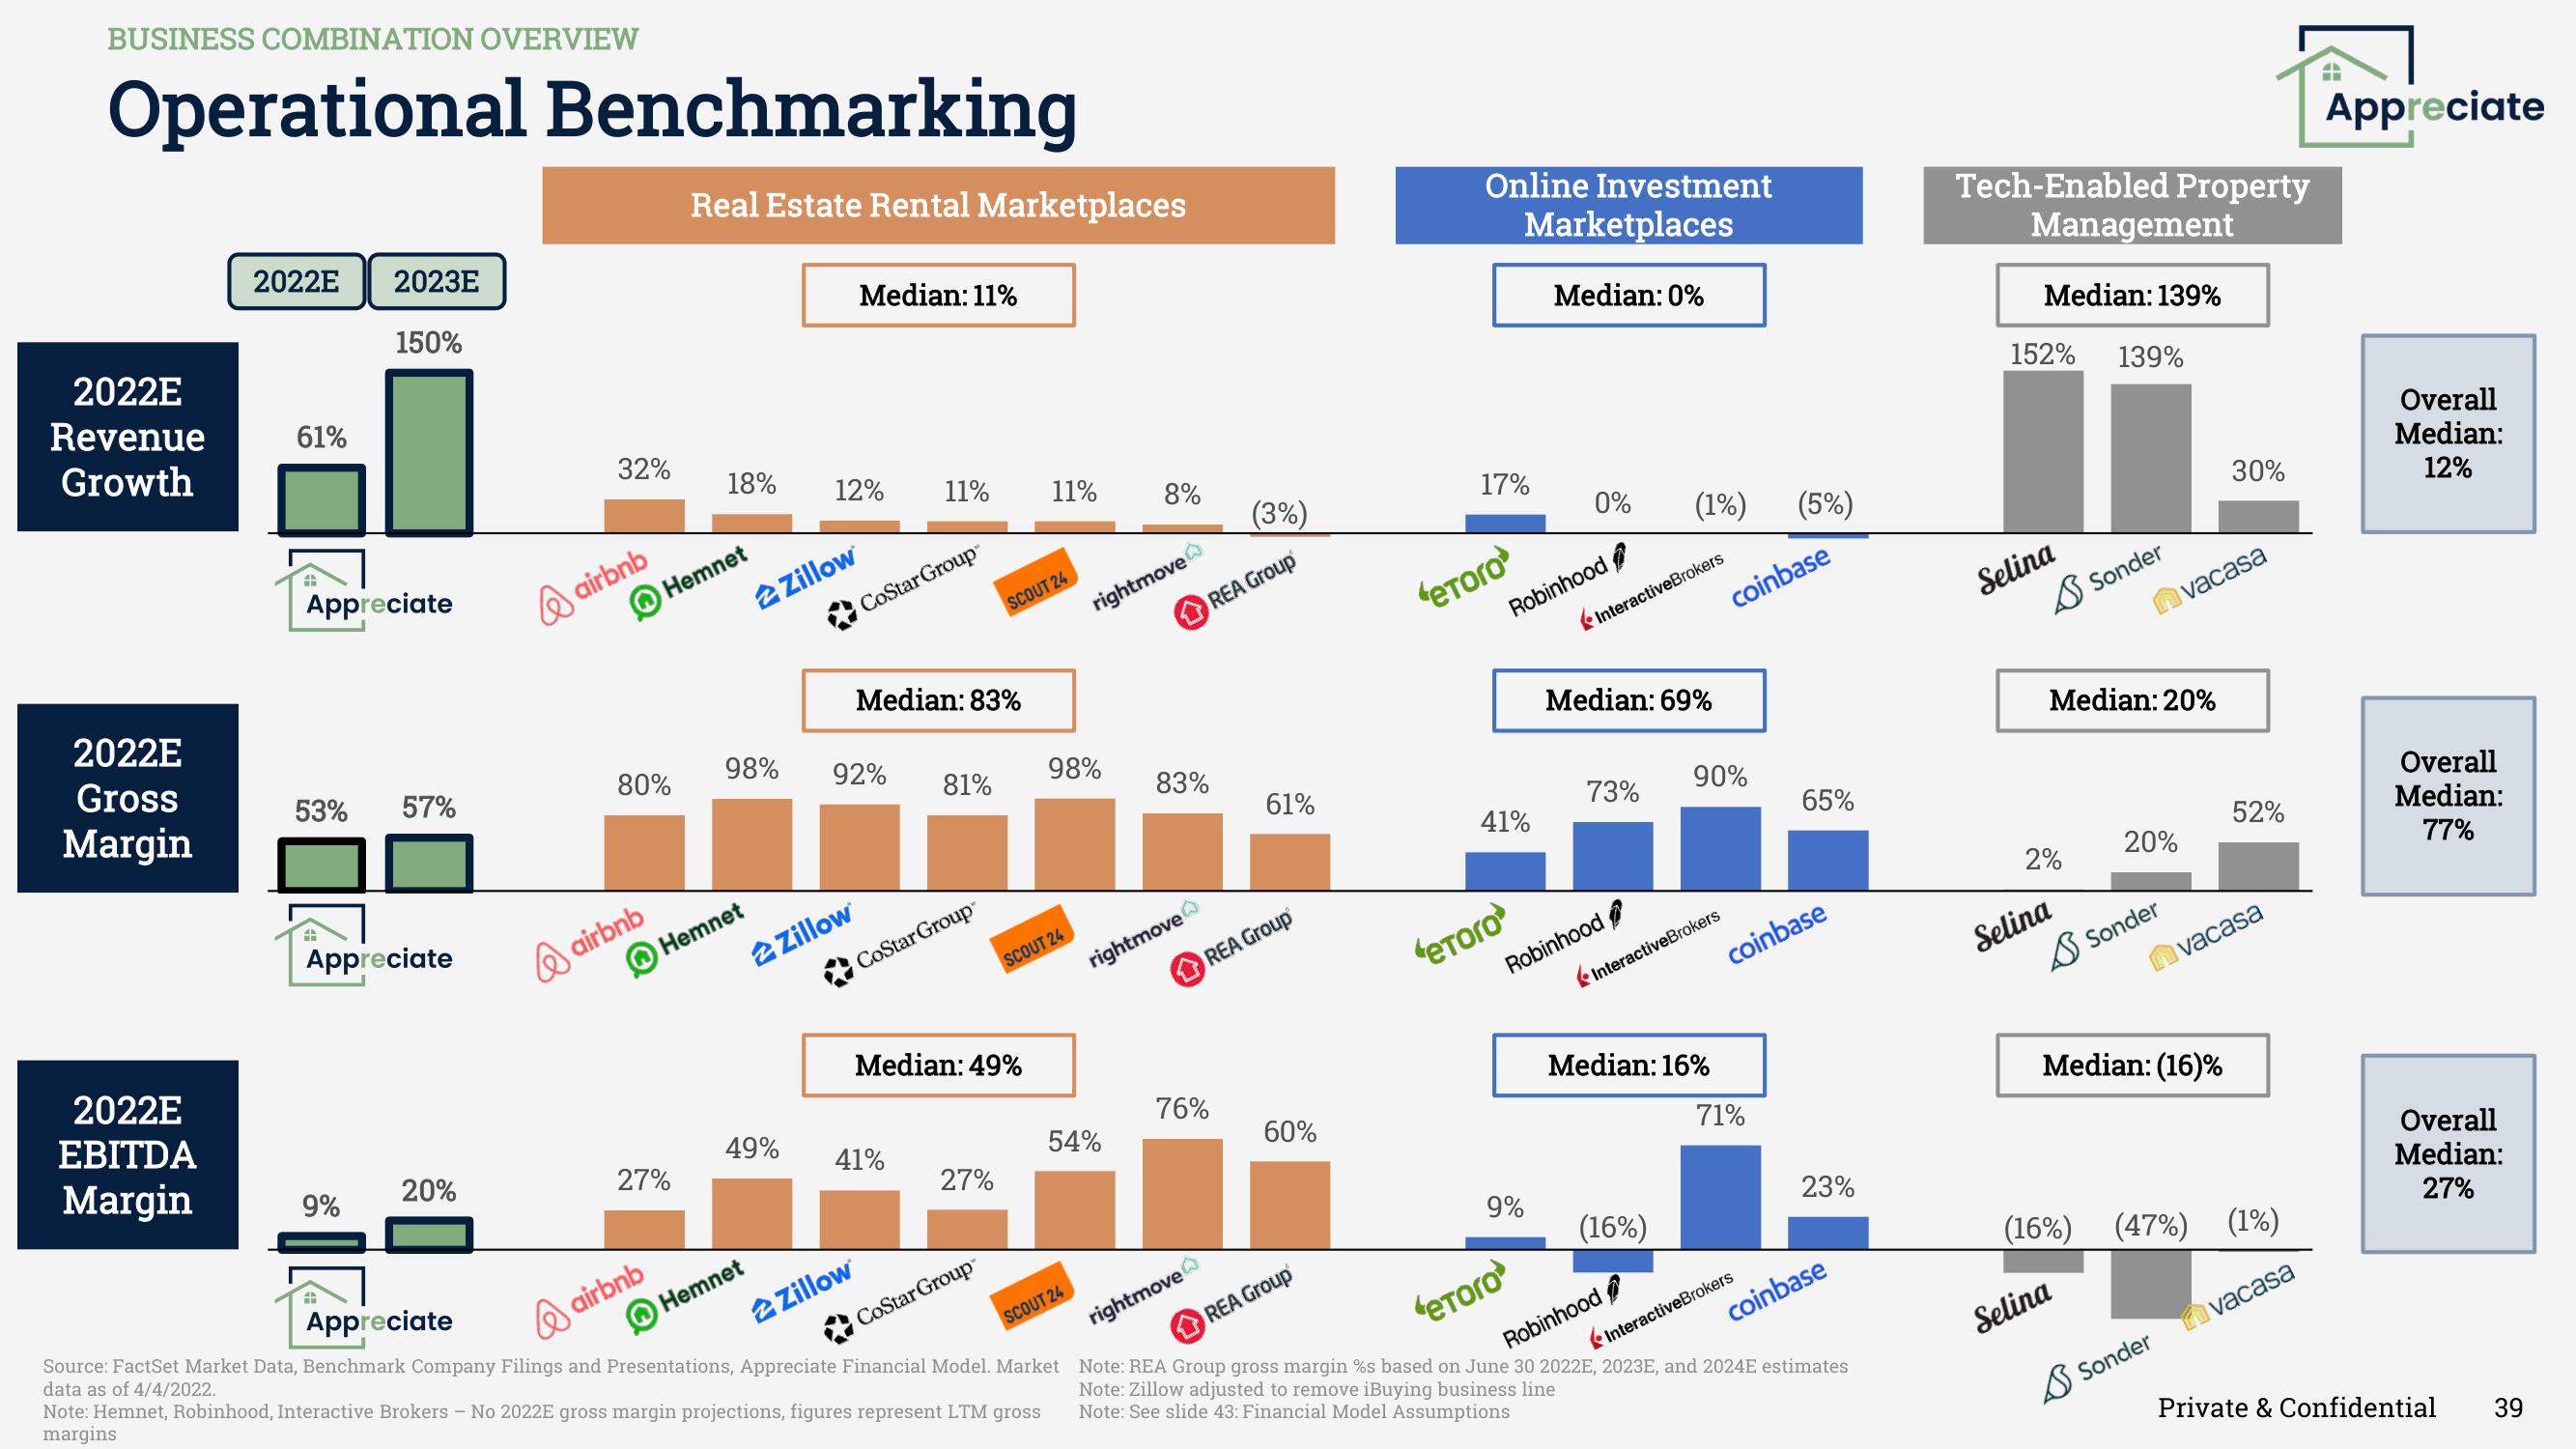
Operational Benchmarking
2022E
Revenue
Growth
2022E
Gross
Margin
2022E
EBITDA
Margin
2022E 2023E
150%
61%
#
Appreciate
53%
57%
Appreciate
9%
20%
32%
airbnb
80%
airbnb
airbnb
Real Estate Rental Marketplaces
Hemnet
27%
18%
Hemnet
2
Zillow
Hemnet
12% 11%
49%
98% 92%
Median: 11%
2 Zillow
CoStar Group™
Median: 83%
Zillow
CoStar Group™
81%
41%
SCOUT 24
Median: 49%
27%
11%
SCOUT 24
98%
Appreciate
Source: FactSet Market Data, Benchmark Company Filings and Presentations, Appreciate Financial Model. Market
data as of 4/4/2022.
CoStar Group™
Note: Hemnet, Robinhood, Interactive Brokers - No 2022E gross margin projections, figures represent LTM gross
margins
SCOUT 24
rightmove
54%
8%
rightmove
83%
REA Group
rightmove
(3%)
76%
61%
REA Group
60%
REA Group
Online Investment
Marketplaces
17%
бетогод
41%
Robinhood
бетого»
Median: 0%
0%
9%
InteractiveBrokers
Median: 69%
73%
Robinhood
(1%)
coinbase
(16%)
90%
InteractiveBrokers
Median: 16%
71%
(5%)
coinbase
65%
InteractiveBrokers
23%
coinbase
Note: REA Group gross margin %s based on June 30 2022E, 2023E, and 2024E estimates
Note: Zillow adjusted to remove iBuying business line
Note: See slide 43: Financial Model Assumptions
бетого
Robinhood
Tech-Enabled Property
Management
Median: 139%
152% 139%
Selina
2%
Median: 20%
Selina
Sonder
(16%)
Selina
20%
Sonder
Median: (16)%
vacasa
30%
Sonder
52%
vacasa
(47%) (1%)
vacasa
4
ww
Appreciate
Overall
Median:
12%
Overall
Median:
77%
Overall
Median:
27%
Private & Confidential
39View entire presentation