Cartrack IPO
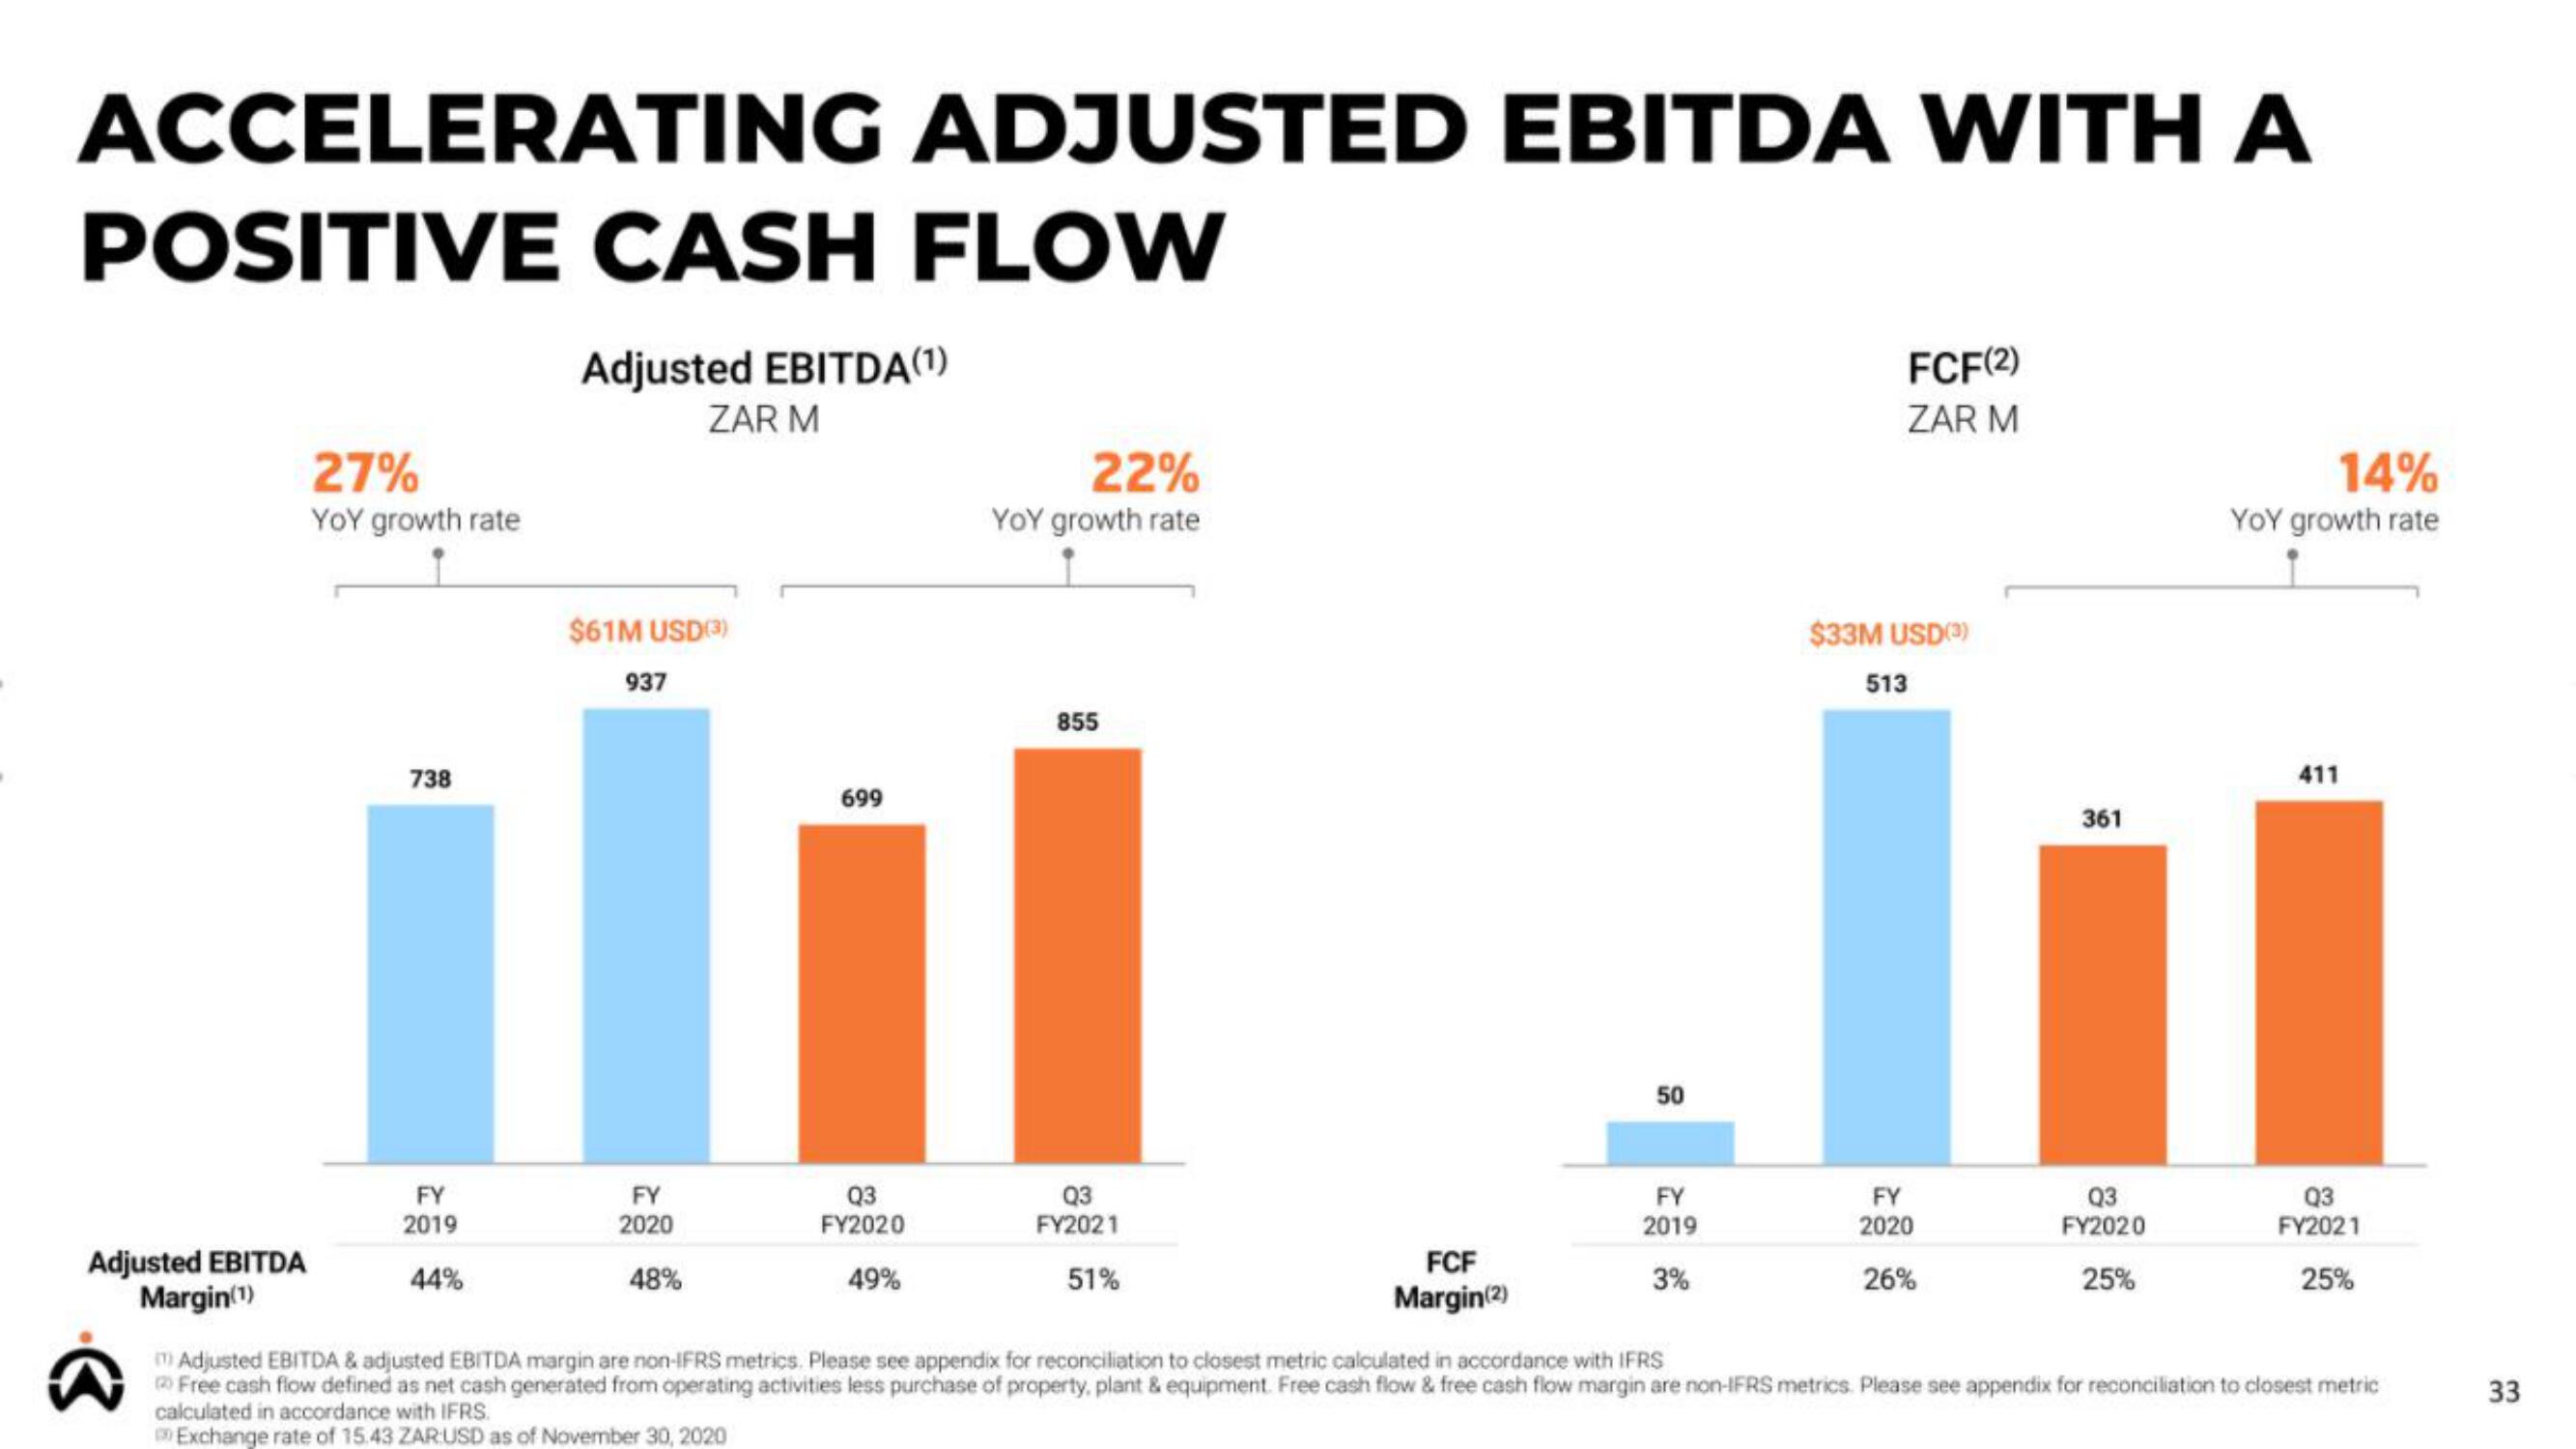
ACCELERATING ADJUSTED EBITDA WITH A
POSITIVE CASH FLOW
Adjusted EBITDA(1)
ZAR M
Adjusted EBITDA
Margin(¹)
27%
YOY growth rate
738
FY
2019
44%
$61M USD(3)
937
FY
2020
48%
699
Q3
FY2020
49%
22%
YOY growth rate
855
Q3
FY2021
51%
FCF
Margin(2)
50
FY
2019
3%
FCF(2)
ZAR M
$33M USD(0)
513
FY
2020
26%
361
Q3
FY2020
25%
14%
YOY growth rate
411
Q3
FY2021
25%
m) Adjusted EBITDA & adjusted EBITDA margin are non-IFRS metrics. Please see appendix for reconciliation to closest metric calculated in accordance with IFRS
20 Free cash flow defined as net cash generated from operating activities less purchase of property, plant & equipment. Free cash flow & free cash flow margin are non-IFRS metrics. Please see appendix for reconciliation to closest metric
calculated in accordance with IFRS.
Exchange rate of 15.43 ZAR:USD as of November 30, 2020
33View entire presentation