Comcast Results Presentation Deck
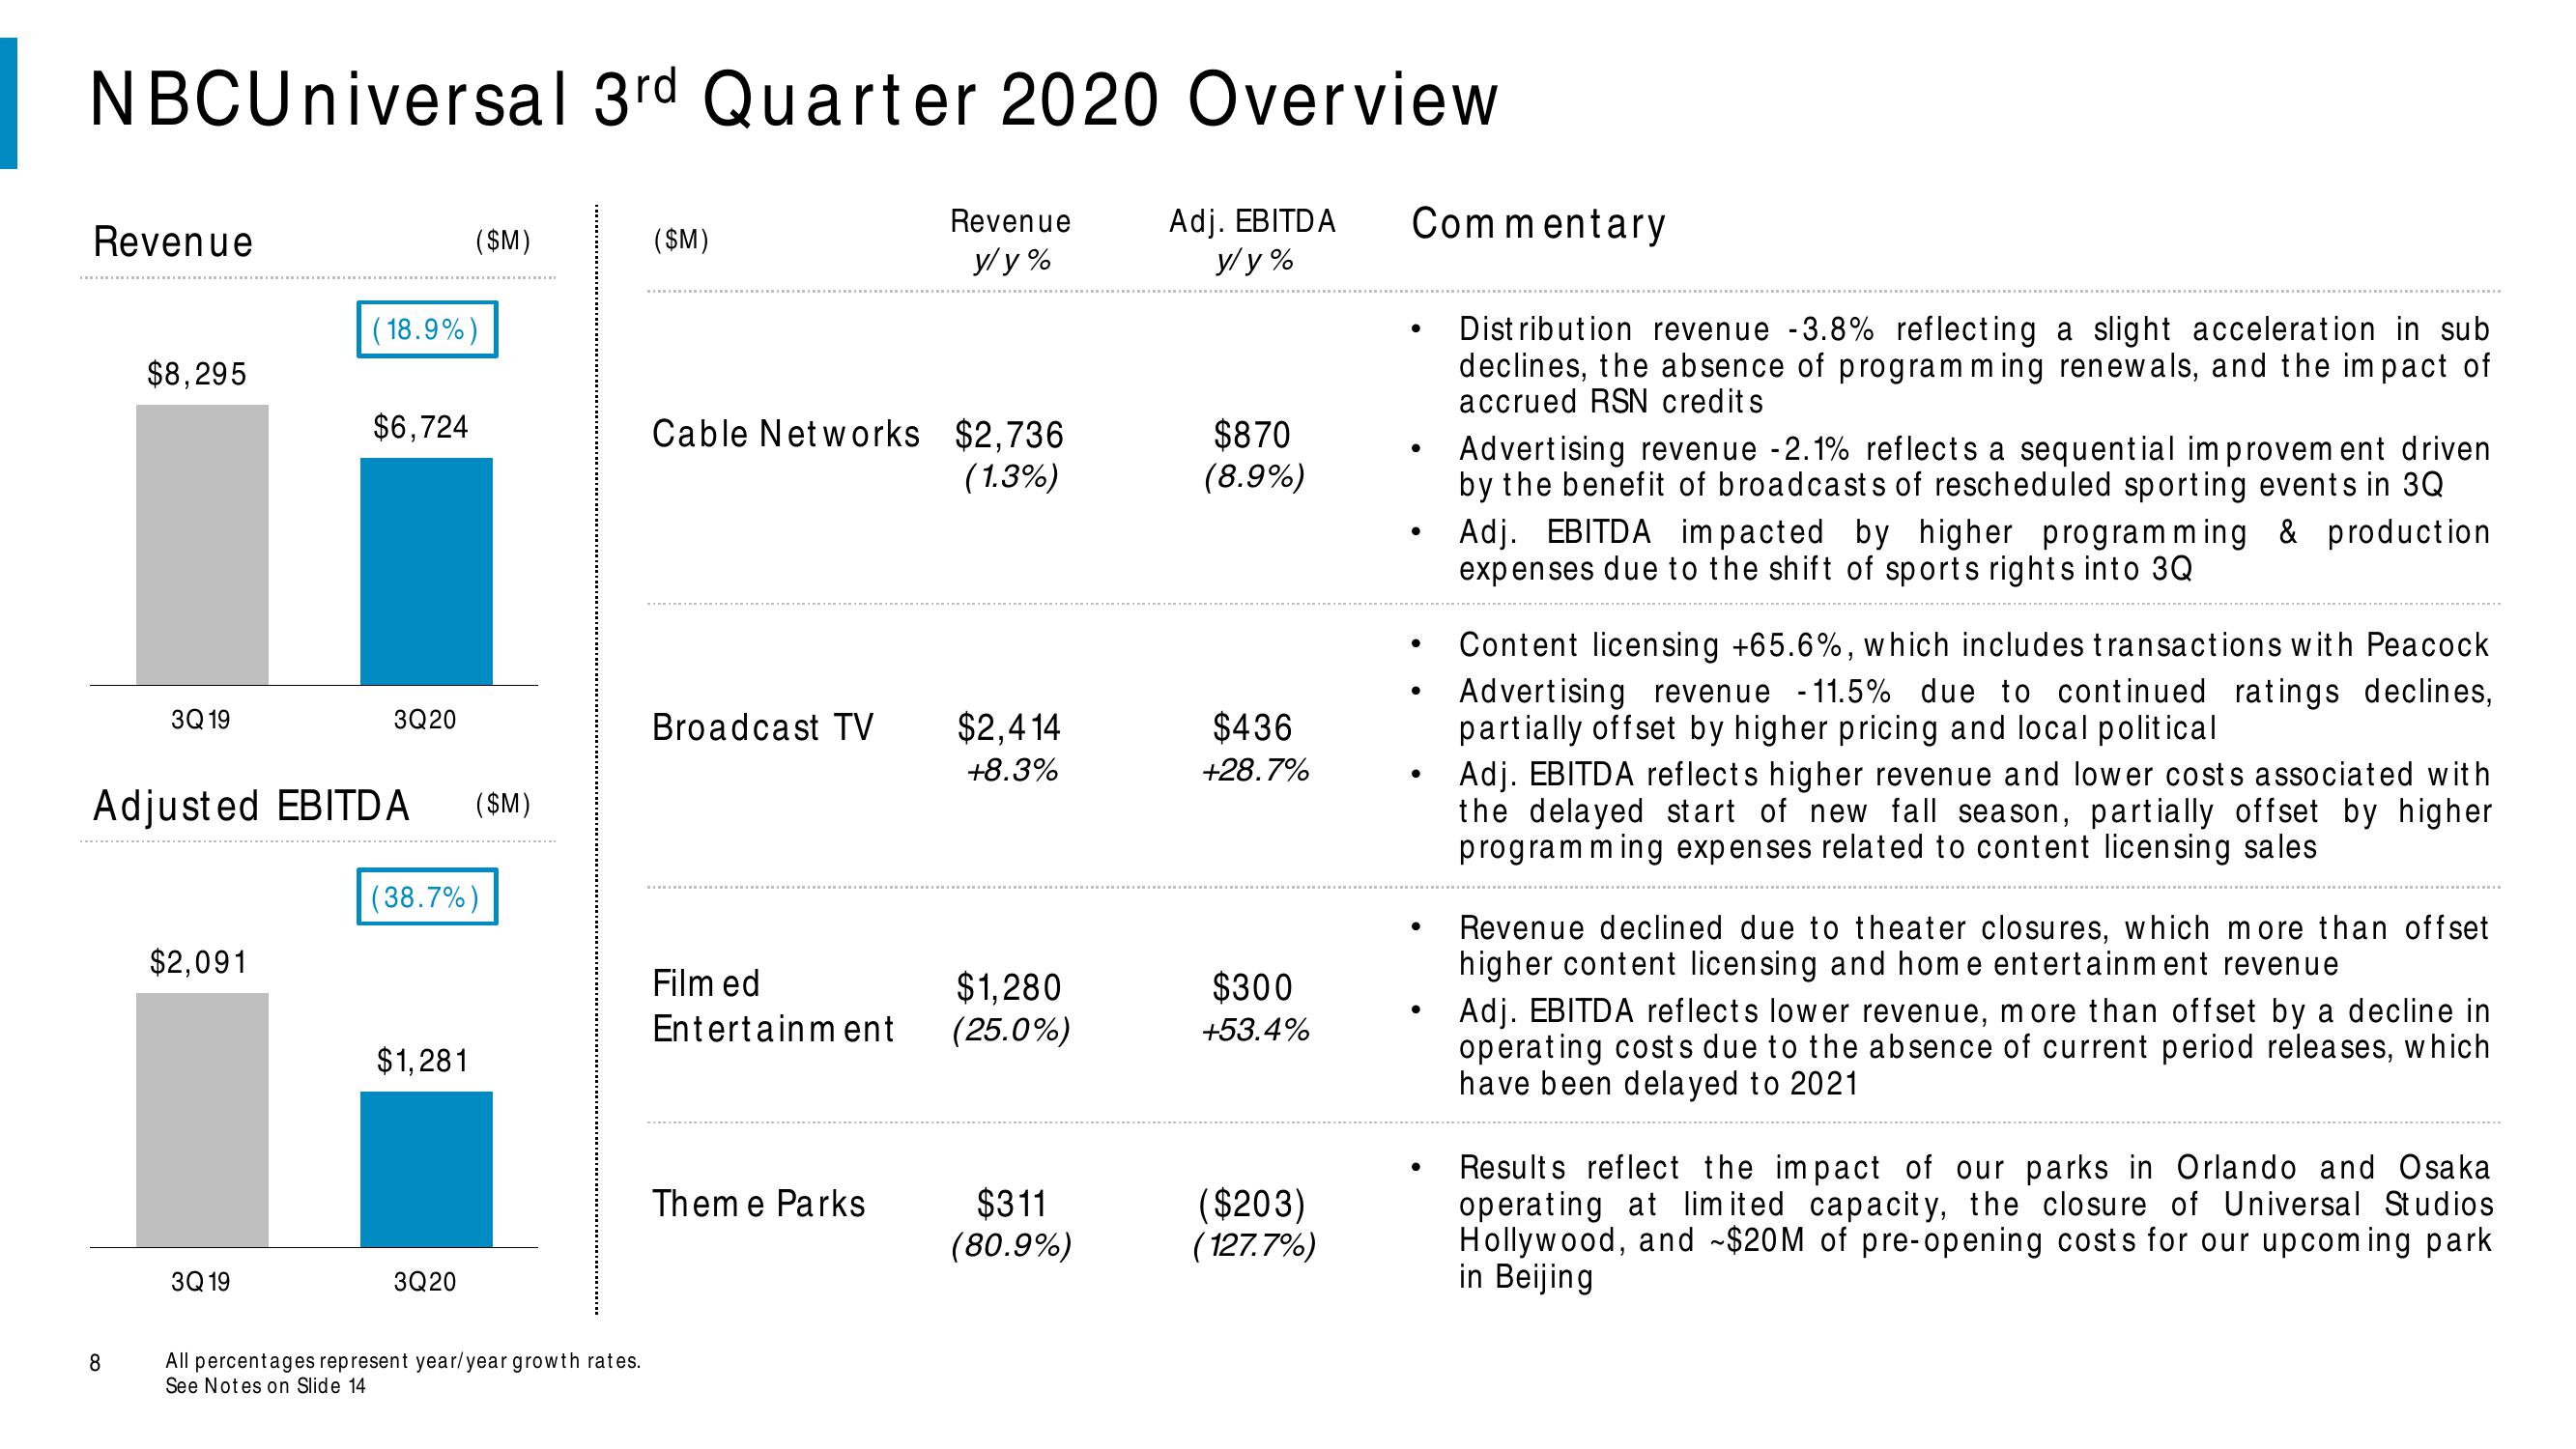
NBCUniversal 3rd Quarter 2020 Overview
Revenue
y/y%
Adj. EBITDA
y/y%
Revenue
$8,295
8
3Q 19
$2,091
3Q 19
(18.9%)
$6,724
Adjusted EBITDA ($M)
3Q20
($M)
(38.7%)
$1,281
3Q20
All percentages represent year/year growth rates.
See Notes on Slide 14
($M)
Cable Networks $2,736
(1.3%)
Broadcast TV
Film ed
Entertainment
Theme Parks
$2,414
+8.3%
$1,280
(25.0%)
$311
(80.9%)
$870
(8.9%)
$436
+28.7%
$300
+53.4%
($203)
(127.7%)
Commentary
●
●
●
●
●
●
●
Distribution revenue -3.8% reflecting a slight acceleration in sub
declines, the absence of programming renewals, and the impact of
accrued RSN credits
Advertising revenue -2.1% reflects a sequential improvement driven
by the benefit of broadcasts of rescheduled sporting events in 3Q
Adj. EBITDA impacted by higher programming & production
expenses due to the shift of sports rights into 3Q
Content licensing +65.6%, which includes transactions with Peacock
Advertising revenue -11.5% due to continued ratings declines,
partially offset by higher pricing and local political
Adj. EBITDA reflects higher revenue and lower costs associated with
the delayed start of new fall season, partially offset by higher
programming expenses related to content licensing sales
Revenue declined due to theater closures, which more than offset
higher content licensing and home entertainment revenue
Adj. EBITDA reflects lower revenue, more than offset by a decline in
operating costs due to the absence of current period releases, which
have been delayed to 2021
Results reflect the impact of our parks in Orlando and Osaka
operating at limited capacity, the closure of Universal Studios
Hollywood, and ~$20M of pre-oper costs for our upcoming park
in BeijingView entire presentation