BenevolentAI SPAC Presentation Deck
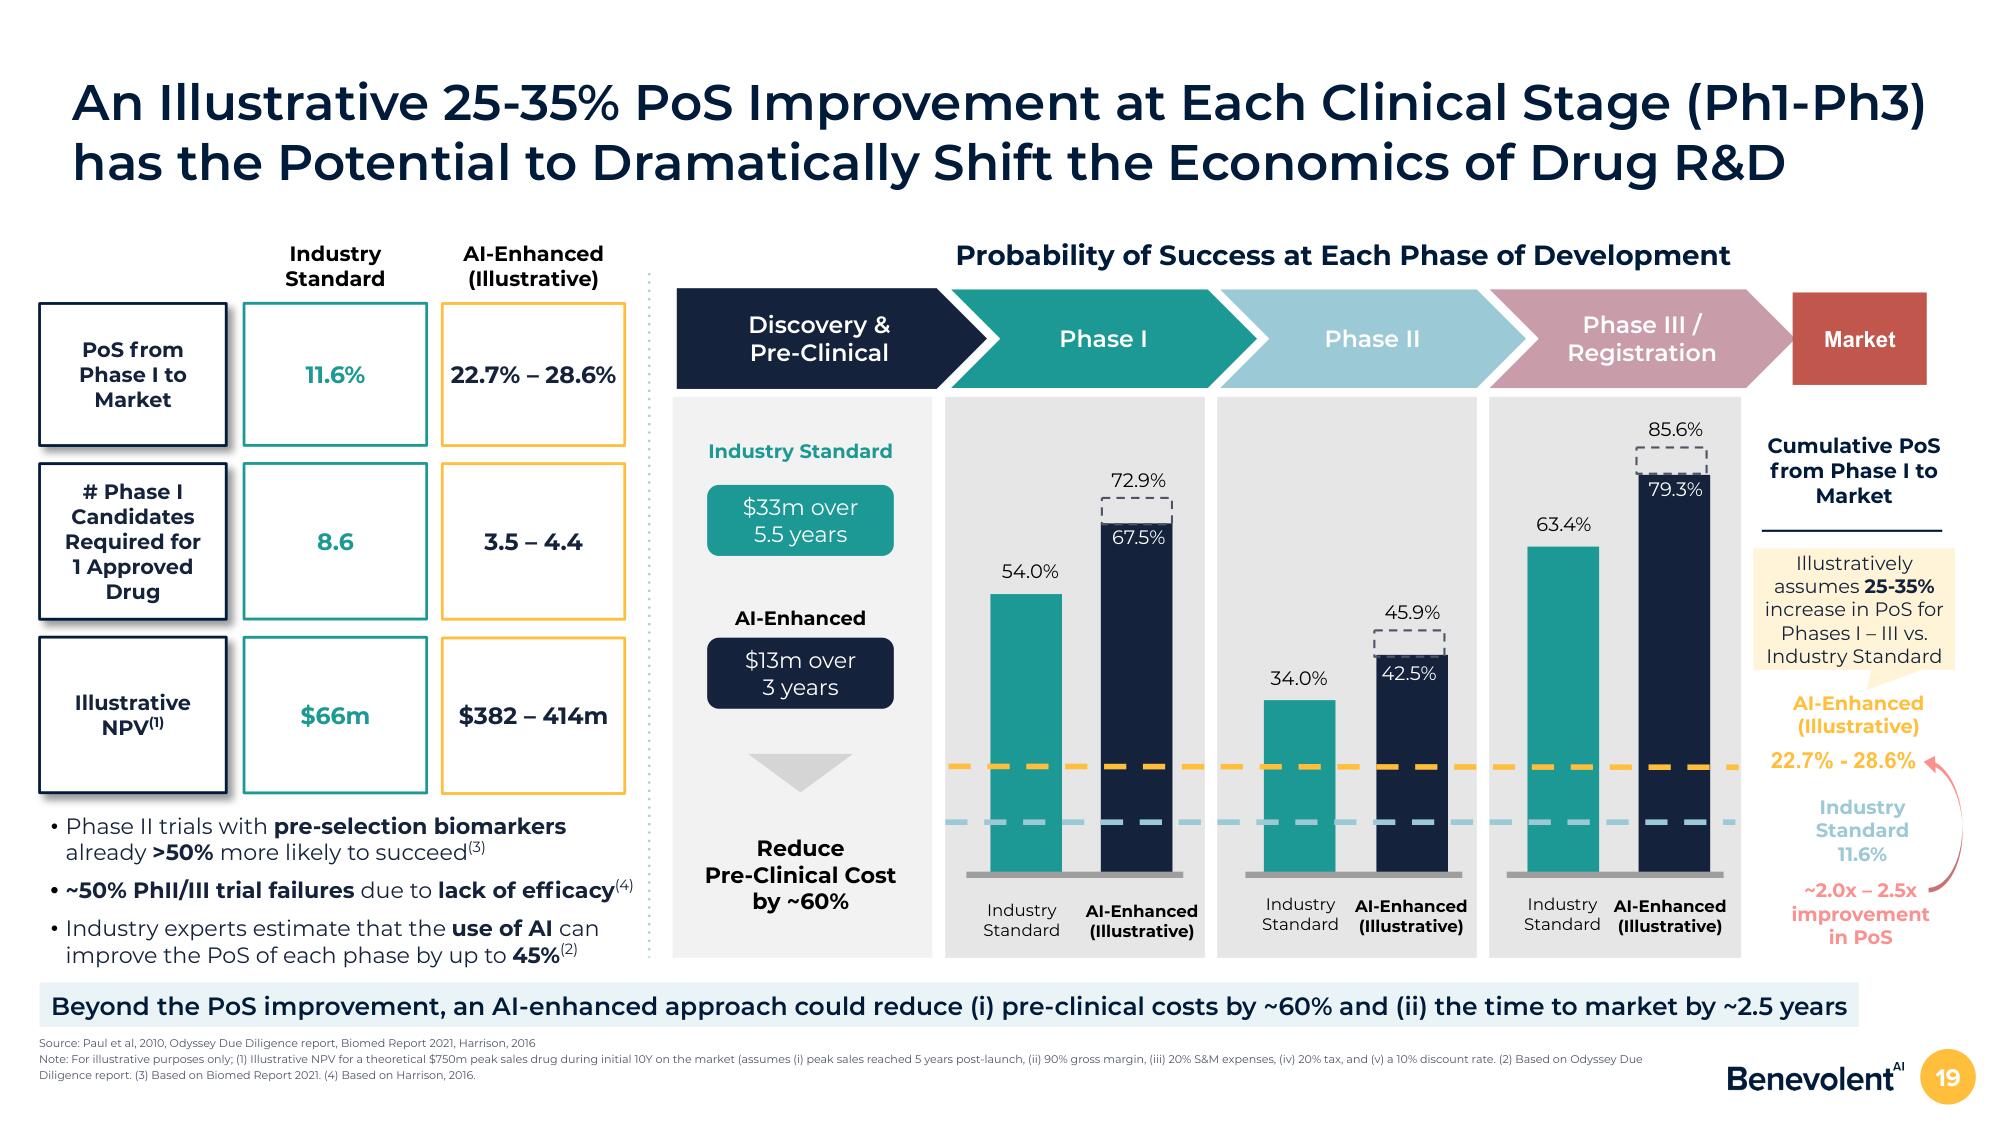
An Illustrative 25-35% POS Improvement at Each Clinical Stage (Phl-Ph3)
has the Potential to Dramatically Shift the Economics of Drug R&D
PoS from
Phase I to
Market
# Phase I
Candidates
Required for
1 Approved
Drug
Illustrative
NPV(¹)
Industry
Standard
11.6%
8.6
$66m
Al-Enhanced
(Illustrative)
22.7% -28.6%
3.5-4.4
$382 - 414m
Discovery &
Pre-Clinical
Industry Standard
$33m over
5.5 years
Al-Enhanced
$13m over
3 years
Probability of Success at Each Phase of Development
Phase III /
Registration
Reduce
Pre-Clinical Cost
by ~60%
54.0%
Phase I
Industry
Standard
72.9%
67.5%
Phase II
Al-Enhanced
(Illustrative)
34.0%
45.9%
42.5%
63.4%
Industry Al-Enhanced
Standard (Illustrative)
85.6%
79.3%
Market
• Phase II trials with pre-selection biomarkers
already >50% more likely to succeed (3)
• ~50% Phil/III trial failures due to lack of efficacy(4)
• Industry experts estimate that the use of Al can
improve the PoS of each phase by up to 45% (2)
Beyond the PoS improvement, an Al-enhanced approach could reduce (i) pre-clinical costs by ~60% and (ii) the time to market by ~2.5 years
Source: Paul et al, 2010, Odyssey Due Diligence report, Biomed Report 2021, Harrison, 2016
Note: For illustrative purposes only; (1) Illustrative NPV for a theoretical $750m peak sales drug during initial 10Y on the market (assumes (i) peak sales reached 5 years post-launch, (ii) 90% gross margin, (iii) 20% S&M expenses, (iv) 20% tax, and (v) a 10% discount rate. (2) Based on Odyssey Due
Diligence report. (3) Based on Biomed Report 2021. (4) Based on Harrison, 2016.
Benevolent 19
Industry Al-Enhanced
Standard (Illustrative)
Cumulative Pos
from Phase I to
Market
Illustratively
assumes 25-35%
increase in PoS for
Phases I-III vs.
Industry Standard
Al-Enhanced
(Illustrative)
22.7% -28.6%
Industry
Standard
11.6%
~2.0x-2.5x
improvement
in PosView entire presentation