Gogoro SPAC Presentation Deck
3.
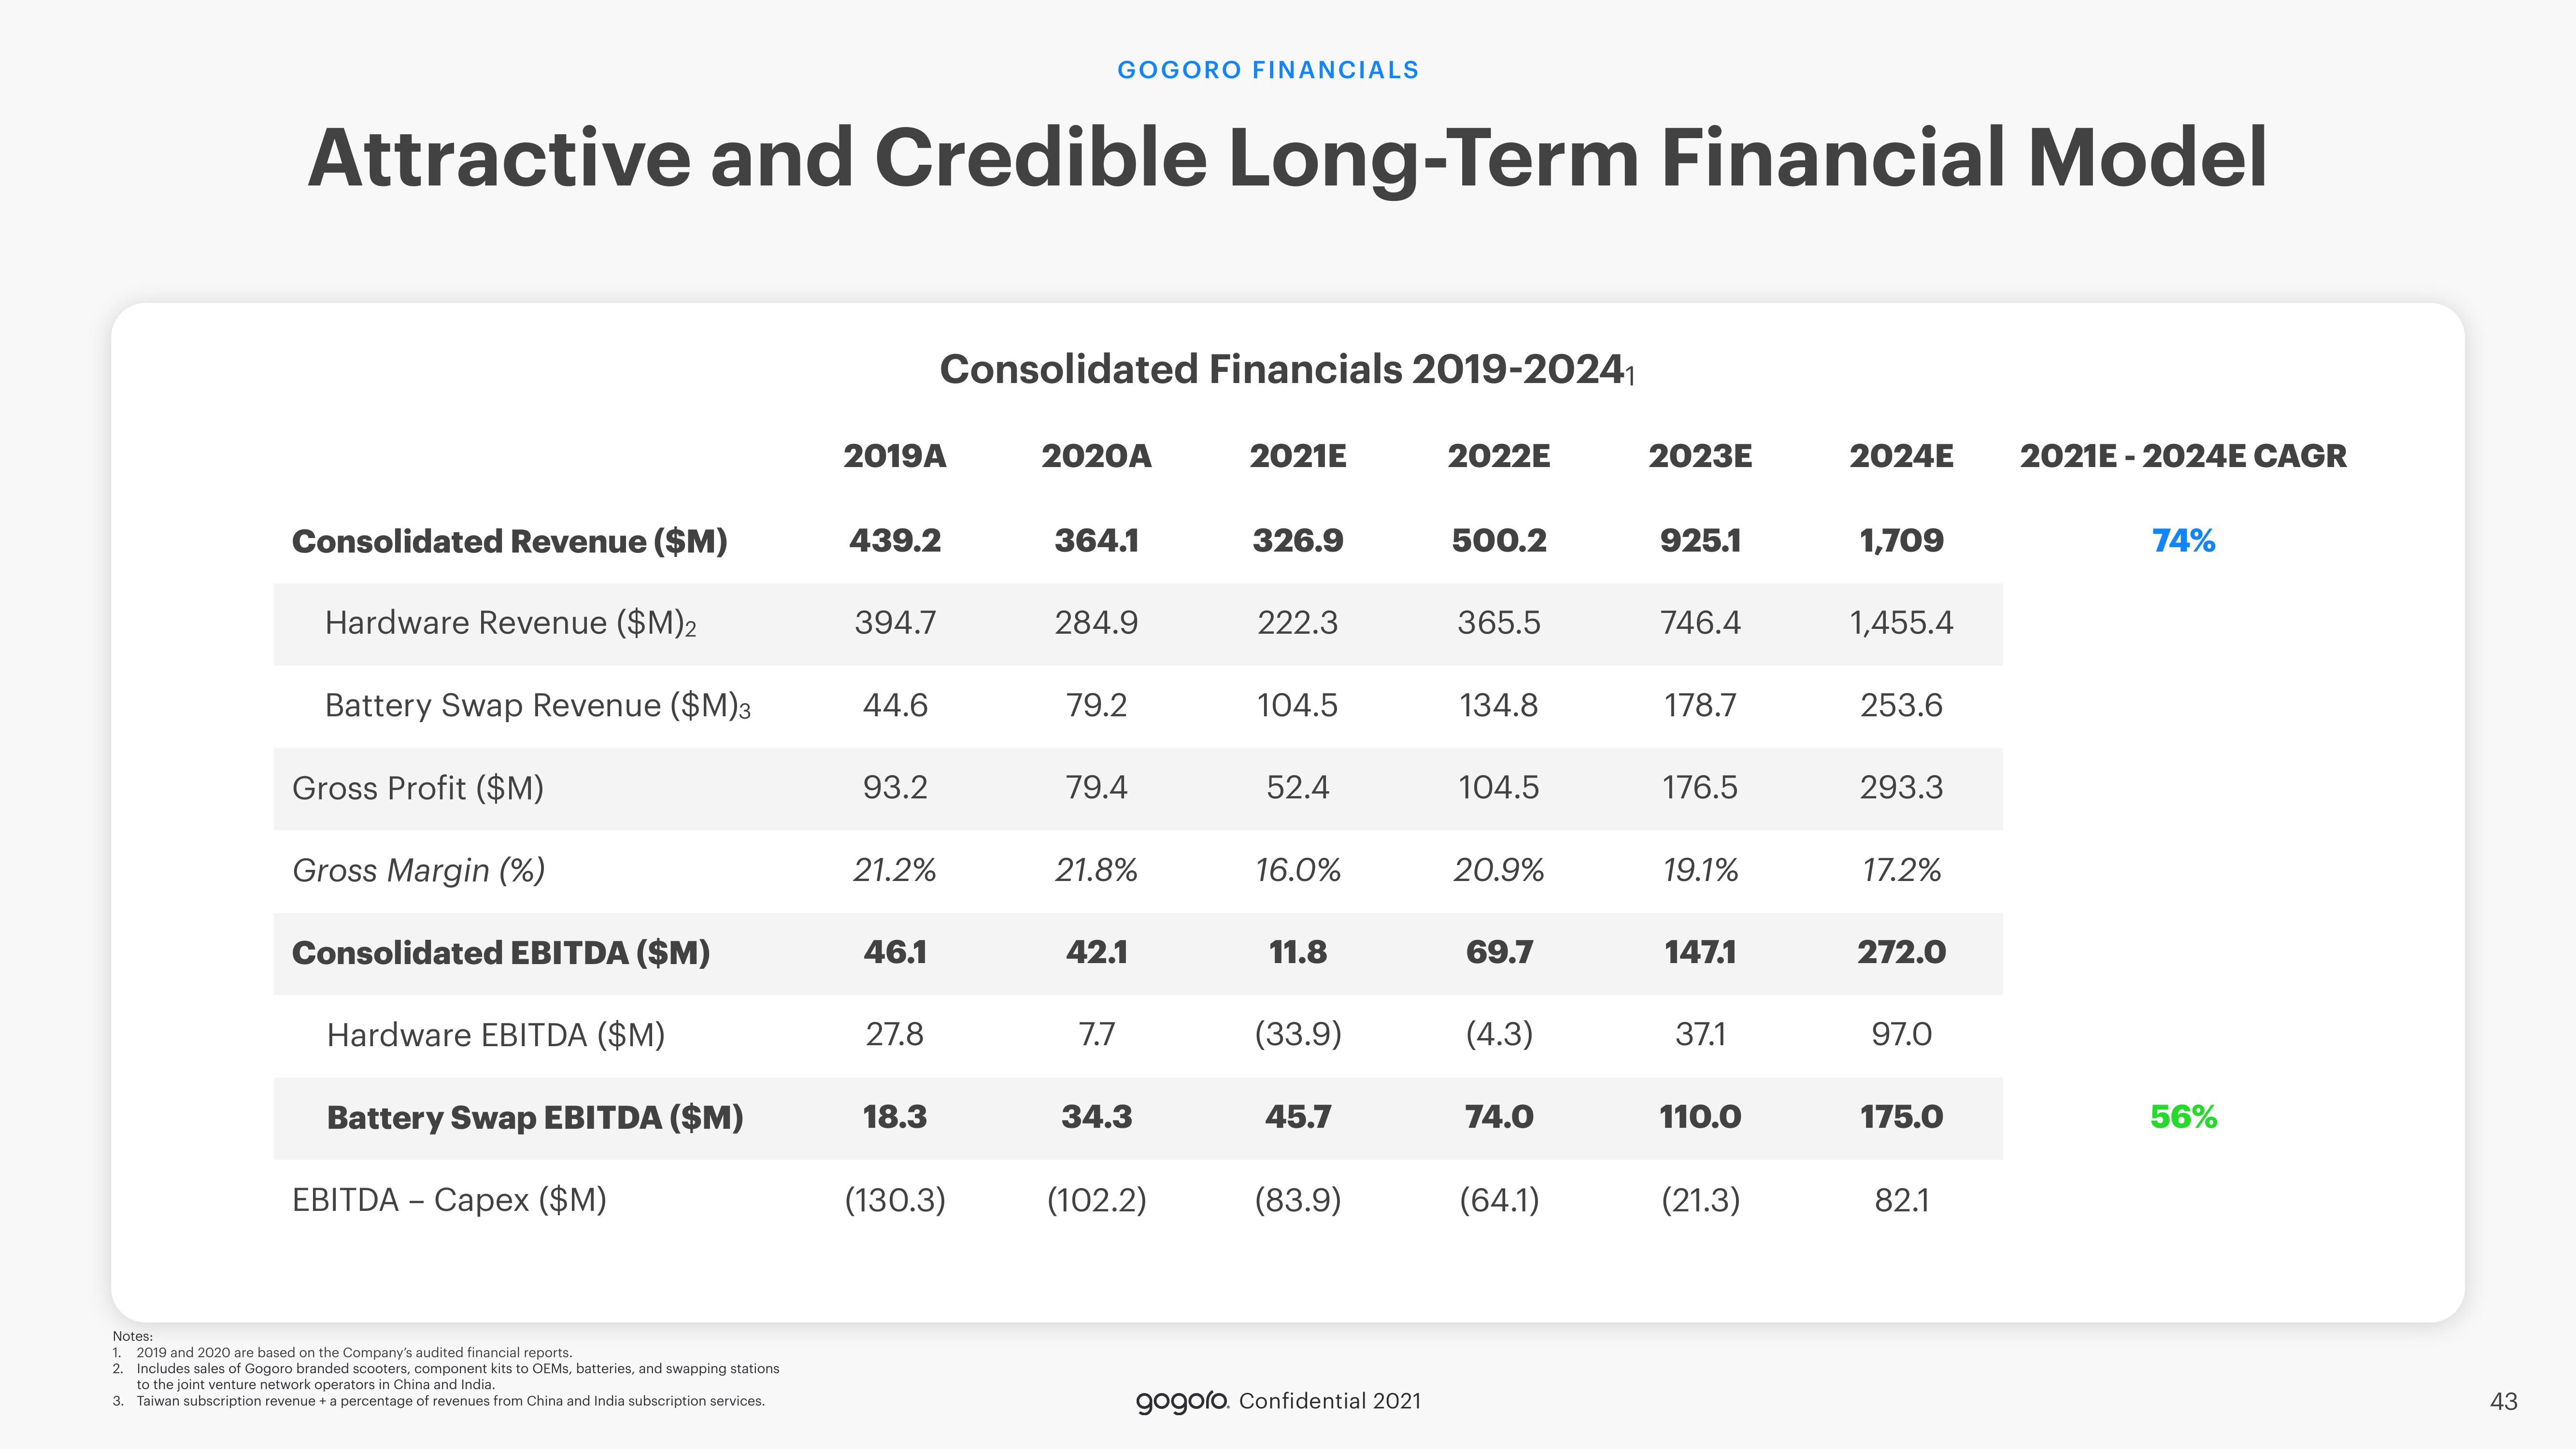
Attractive and Credible Long-Term Financial Model
Consolidated Revenue ($M)
Hardware Revenue ($M)2
Battery Swap Revenue ($M)3
Gross Profit ($M)
Gross Margin (%)
Consolidated EBITDA ($M)
Hardware EBITDA ($M)
Battery Swap EBITDA ($M)
EBITDA - Capex ($M)
Notes:
1. 2019 and 2020 are based on the Company's audited financial reports.
2. Includes sales of Gogoro branded scooters, component kits to OEMs, batteries, and swapping stations
to the joint venture network operators in China and India.
Taiwan subscription revenue + a percentage of revenues from China and India subscription services.
2019A
439.2
394.7
44.6
93.2
21.2%
46.1
27.8
Consolidated Financials 2019-20241
18.3
GOGORO FINANCIALS
(130.3)
2020A
364.1
284.9
79.2
79.4
21.8%
42.1
7.7
34.3
(102.2)
2021E
326.9
222.3
104.5
52.4
16.0%
11.8
(33.9)
45.7
(83.9)
gogoro. Confidential 2021
2022E
500.2
365.5
134.8
104.5
20.9%
69.7
(4.3)
74.0
(64.1)
2023E
925.1
746.4
178.7
176.5
19.1%
147.1
37.1
110.0
(21.3)
2024E 2021E-2024E CAGR
1,709
1,455.4
253.6
293.3
17.2%
272.0
97.0
175.0
82.1
74%
56%
43View entire presentation