Lyft Results Presentation Deck
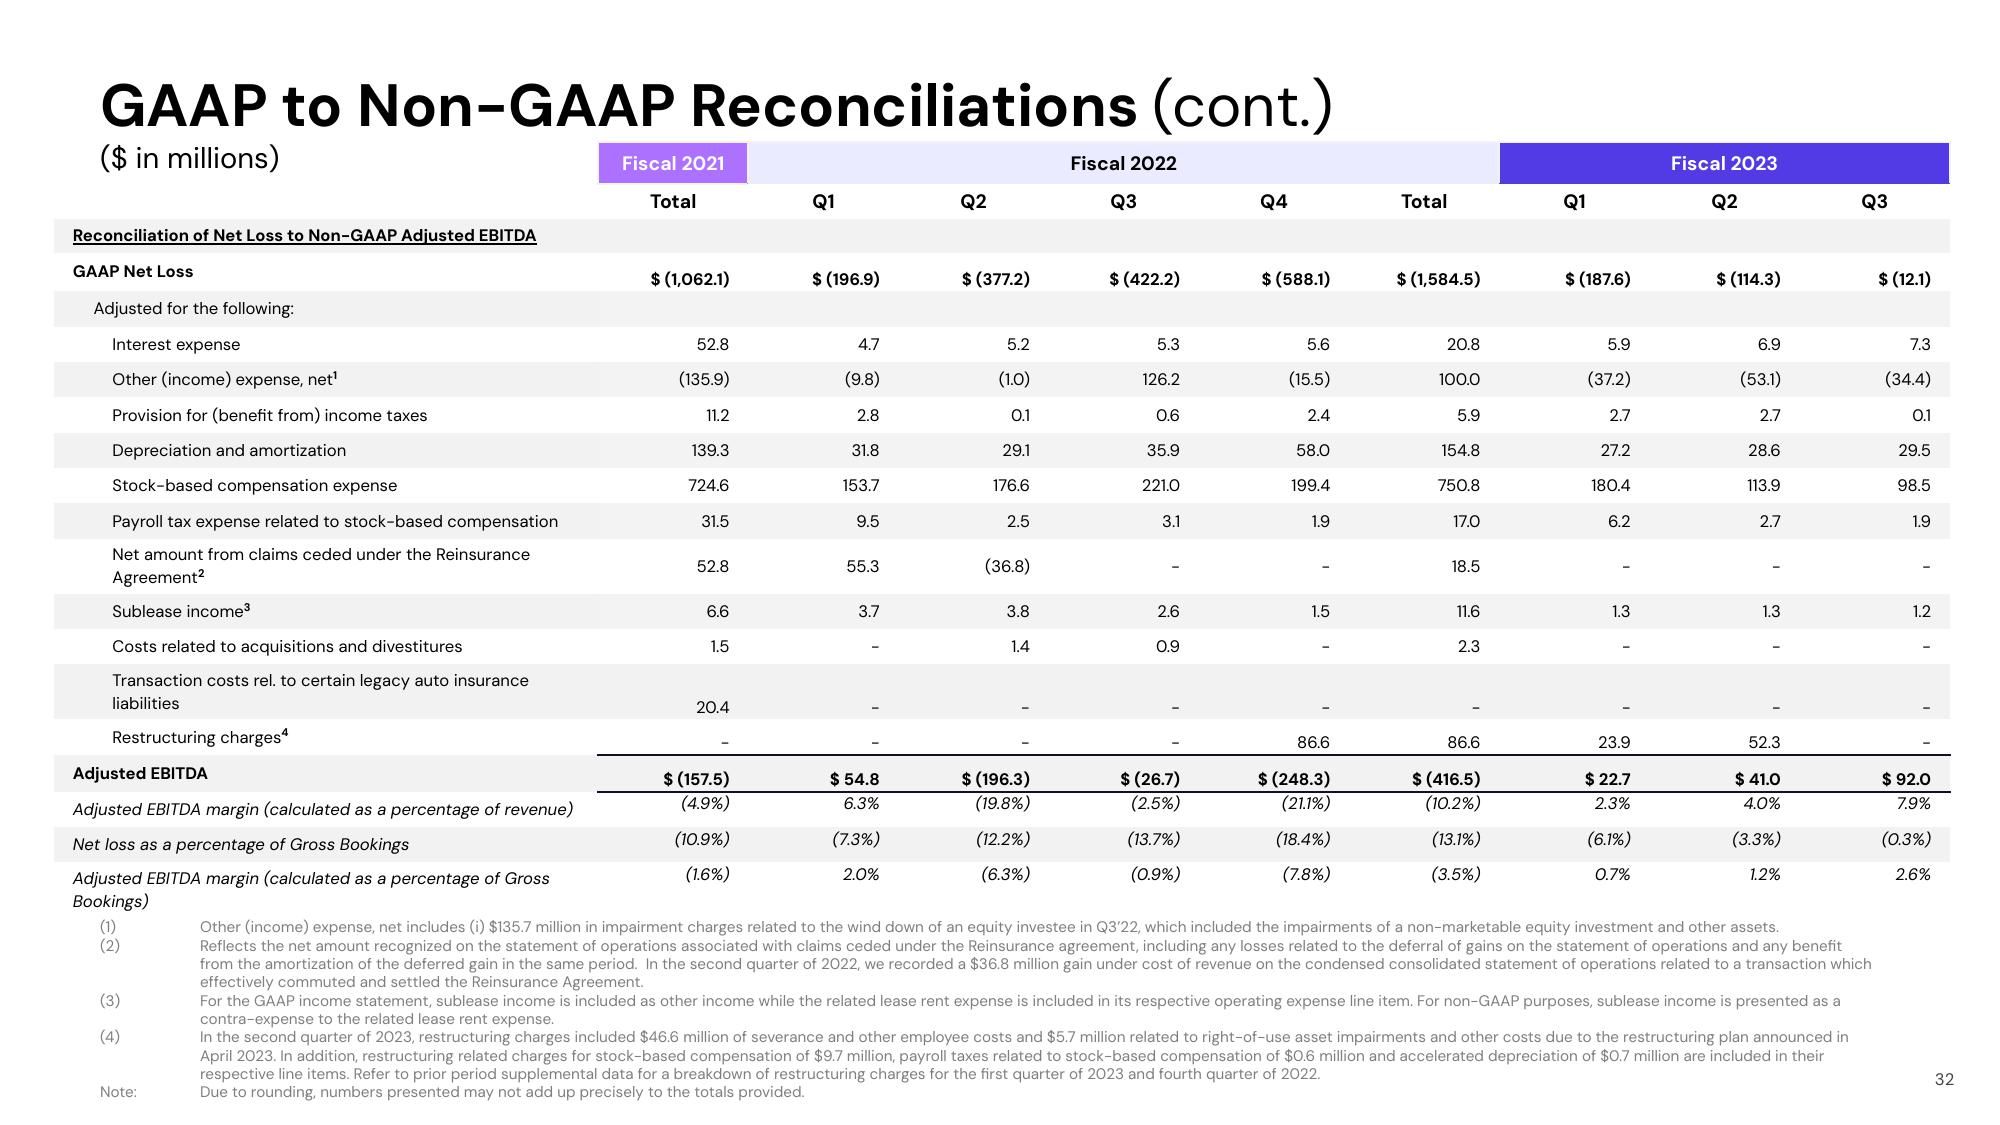
GAAP to Non-GAAP Reconciliations (cont.)
($ in millions)
Reconciliation of Net Loss to Non-GAAP Adjusted EBITDA
GAAP Net Loss
Adjusted for the following:
Interest expense
Other (income) expense, net¹
Provision for (benefit from) income taxes
Depreciation and amortization
Stock-based compensation expense
Payroll tax expense related to stock-based compensation
Net amount from claims ceded under the Reinsurance
Agreement²
Sublease income³
Costs related to acquisitions and divestitures
Transaction costs rel. to certain legacy auto insurance
liabilities
Restructuring charges4
Adjusted EBITDA
Adjusted EBITDA margin (calculated as a percentage of revenue)
Net loss as a percentage of Gross Bookings
Adjusted EBITDA margin (calculated as a percentage of Gross
Bookings)
(1)
(2)
(3)
(4)
Note:
Fiscal 2021
Total
$ (1,062.1)
52.8
(135.9)
11.2
139.3
724.6
31.5
52.8
6.6
1.5
20.4
$ (157.5)
(4.9%)
(10.9%)
(1.6%)
Q1
$ (196.9)
4.7
(9.8)
2.8
31.8
153.7
9.5
55.3
3.7
$ 54.8
6.3%
(7.3%)
2.0%
Q2
$ (377.2)
5.2
(1.0)
0.1
29.1
176.6
2.5
(36.8)
3.8
1.4
$ (196.3)
(19.8%)
(12.2%)
(6.3%)
Fiscal 2022
Q3
$ (422.2)
5.3
126.2
0.6
35.9
221.0
3.1
2.6
0.9
$ (26.7)
(2.5%)
(13.7%)
(0.9%
Q4
$ (588.1)
5.6
(15.5)
2.4
58.0
199.4
1.9
1.5
86.6
$ (248.3)
(21.1%)
(18.4%)
(7.8%)
Total
$ (1,584.5)
20.8
100.0
5.9
154.8
750.8
17.0
18.5
11.6
2.3
86.6
$ (416.5)
(10.2%)
(13.1%)
3.5%)
Q1
$ (187.6)
5.9
(37.2)
2.7
27.2
180.4
6.2
1.3
23.9
$22.7
2.3%
(6.1%)
0.7%
Fiscal 2023
Q2
$ (114.3)
6.9
(53.1)
2.7
28.6
113.9
2.7
1.3
52.3
$ 41.0
4.0%
(3.3%)
1.2%
Q3
Other (income) expense, net includes (i) $135.7 million in impairment charges related to the wind down of an equity investee in Q3'22, which included the impairments of a non-marketable equity investment and other assets.
Reflects the net amount recognized on the statement of operations associated with claims ceded under the Reinsurance agreement, including any losses related to the deferral of gains on the statement of operations and any benefit
from the amortization of the deferred gain in the same period. In the second quarter of 2022, recorded a $36.8 million gain under cost of revenue on the condensed consolidated statement of operations related to a transaction which
effectively commuted and settled the Reinsurance Agreement.
For the GAAP income statement, sublease income is included as other income while the related lease rent expense is included in its respective operating expense line item. For non-GAAP purposes, sublease income is presented as a
contra-expense to the related lease rent expense.
In the second quarter of 2023, restructuring charges included $46.6 million of severance and other employee costs and $5.7 million related to right-of-use asset impairments and other costs due to the restructuring plan announced in
April 2023. In addition, restructuring related charges for stock-based compensation of $9.7 million, payroll taxes related to stock-based compensation of $0.6 million and accelerated depreciation of $0.7 million are included in their
respective line items. Refer to prior period supplemental data for a breakdown of restructuring charges for the first quarter of 2023 and fourth quarter of 2022.
Due to rounding, numbers presented may not add up precisely to the totals provided.
$ (12.1)
7.3
(34.4)
0.1
29.5
98.5
1.9
1.2
$ 92.0
7.9%
(0.3%)
2.6%
32View entire presentation