Samsara Investor Presentation Deck
21
Samsara Inc.
samsara
GAAP S&M expense
Less: Stock-based compensation
expense-related charges
Less: Compensation expense in
connection with 2019 tender offer
Non-GAAP S&M expense
Non-GAAP S&M margin (% of total revenue)
GAAP R&D expense
Less: Stock-based compensation
expense-related charges
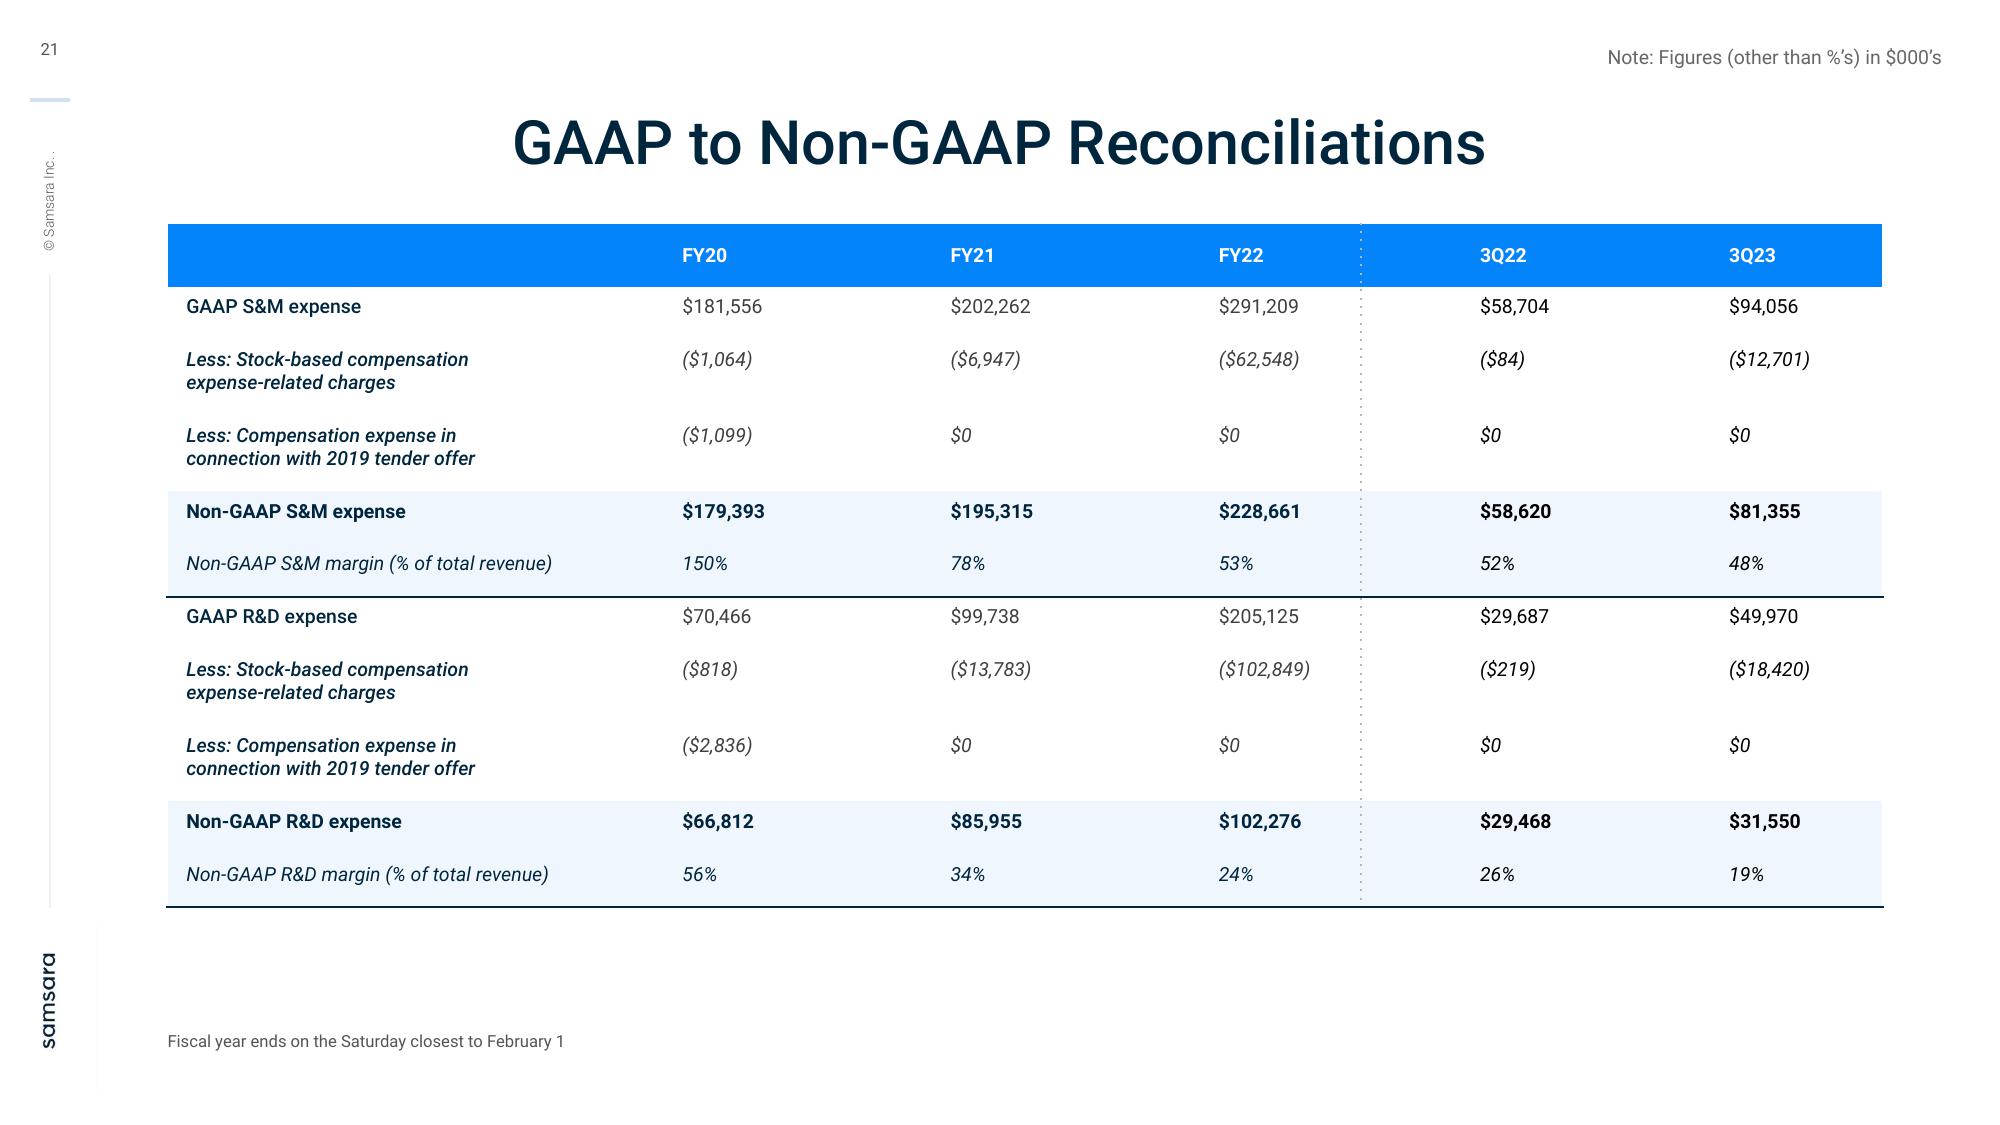
GAAP to Non-GAAP Reconciliations
Less: Compensation expense in
connection with 2019 tender offer
Non-GAAP R&D expense
Non-GAAP R&D margin of total revenue)
Fiscal year ends on the Saturday closest to February 1
FY20
$181,556
($1,064)
($1,099)
$179,393
150%
$70,466
($818)
($2,836)
$66,812
FY21
$202,262
($6,947)
$0
$195,315
78%
$99,738
($13,783)
$0
$85,955
34%
FY22
$291,209
($62,548)
$0
$228,661
53%
$205,125
($102,849)
$0
$102,276
24%
3Q22
$58,704
($84)
$0
$58,620
52%
$29,687
($219)
$0
$29,468
26%
Note: Figures (other than %'s) in $000's
3Q23
$94,056
($12,701)
$0
$81,355
48%
$49,970
($18,420)
$0
$31,550
19%View entire presentation