Spotify Results Presentation Deck
Financial Summary
Revenue
Profitability
Free Cash Flow
& Liquidity
Spotify
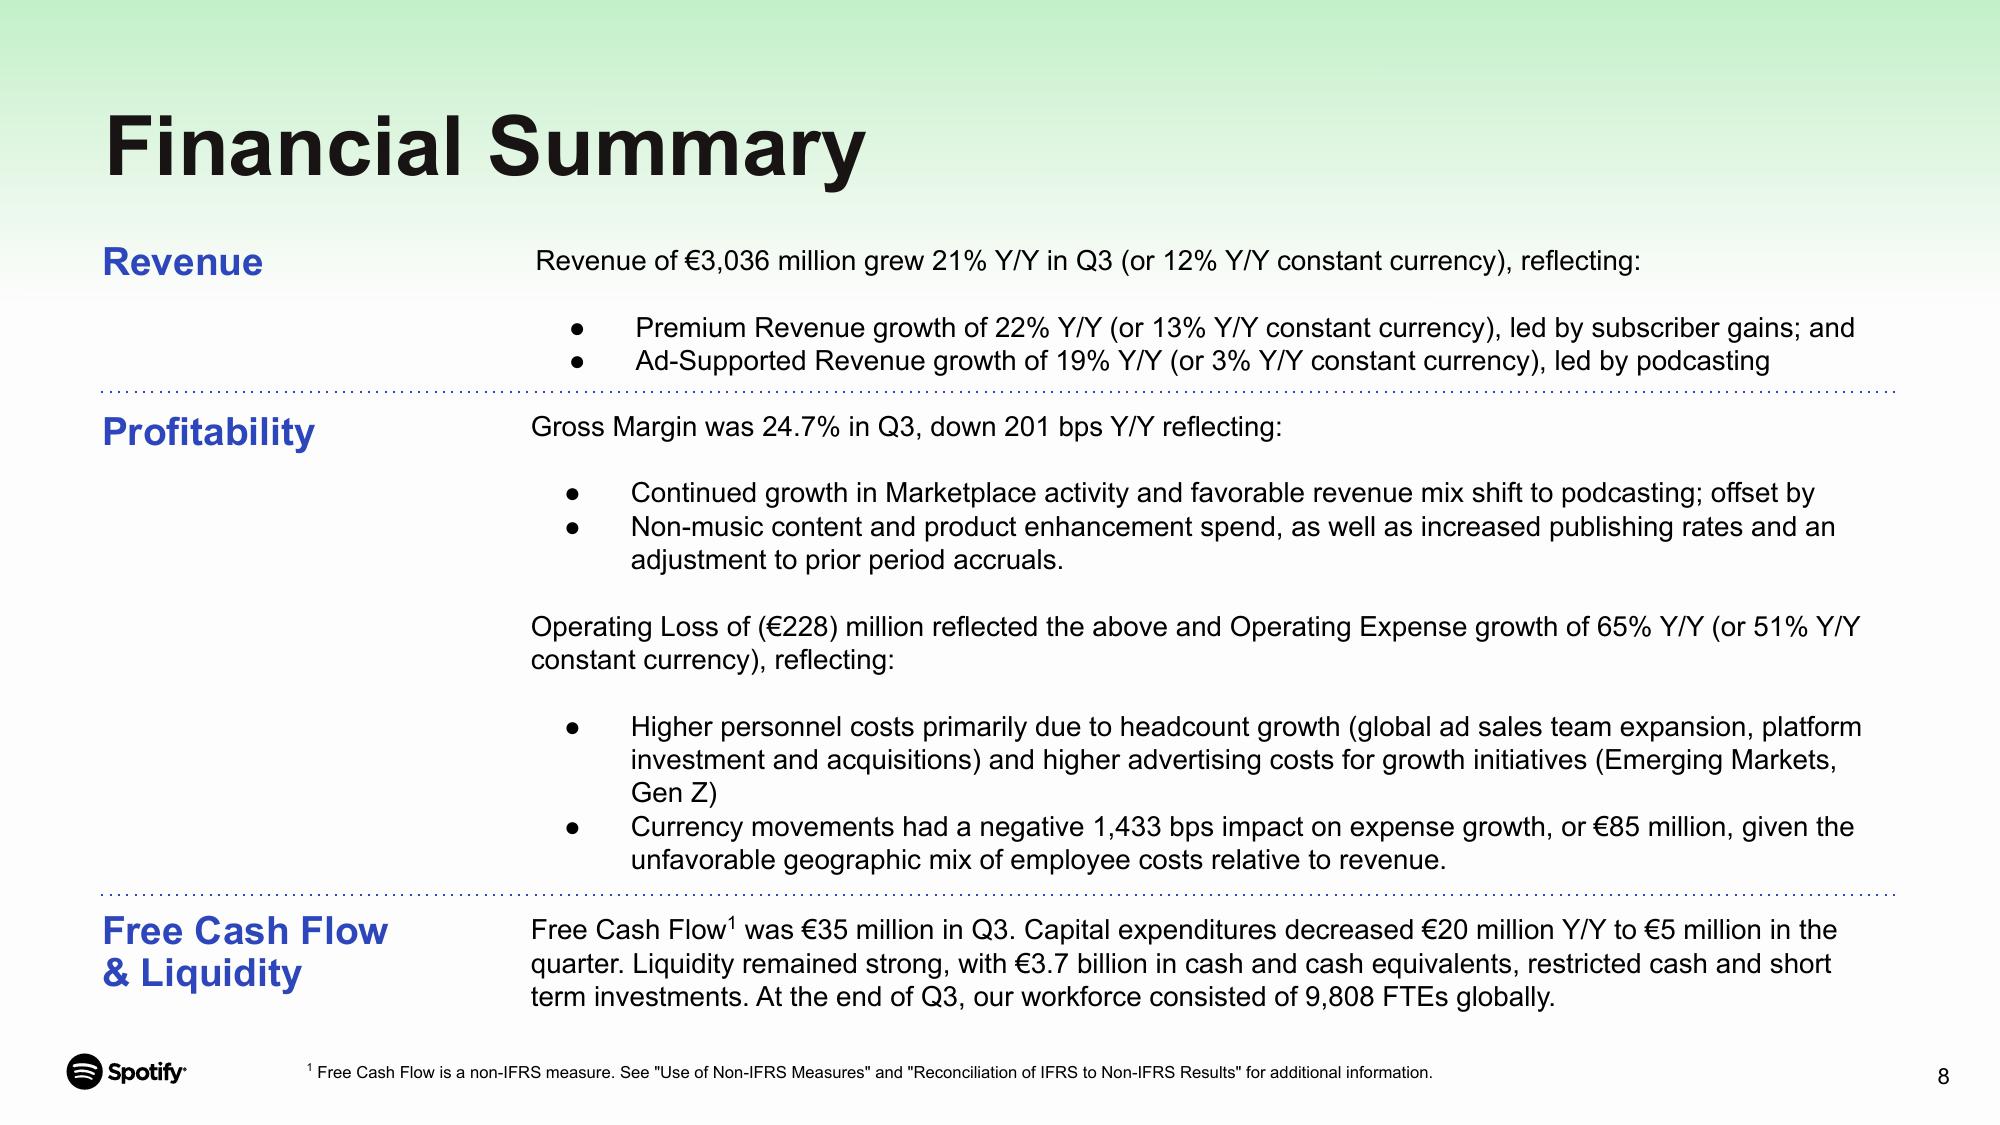
Revenue of €3,036 million grew 21% Y/Y in Q3 (or 12% Y/Y constant currency), reflecting:
Premium Revenue growth of 22% Y/Y (or 13% Y/Y constant currency), led by subscriber gains; and
Ad-Supported Revenue growth of 19% Y/Y (or 3% Y/Y constant currency), led by podcasting
Gross Margin was 24.7% in Q3, down 201 bps Y/Y reflecting:
Continued growth in Marketplace activity and favorable revenue mix shift to podcasting; offset by
Non-music content and product enhancement spend, as well as increased publishing rates and an
adjustment to prior period accruals.
Operating Loss of (€228) million reflected the above and Operating Expense growth of 65% Y/Y (or 51% Y/Y
constant currency), reflecting:
Higher personnel costs primarily due to headcount growth (global ad sales team expansion, platform
investment and acquisitions) and higher advertising costs for growth initiatives (Emerging Markets,
Gen Z)
Currency movements had a negative 1,433 bps impact on expense growth, or €85 million, given the
unfavorable geographic mix of employee costs relative to revenue.
Free Cash Flow¹ was €35 million in Q3. Capital expenditures decreased €20 million Y/Y to €5 million in the
quarter. Liquidity remained strong, with €3.7 billion in cash and cash equivalents, restricted cash and short
term investments. At the end of Q3, our workforce consisted of 9,808 FTEs globally.
1 Free Cash Flow is a non-IFRS measure. See "Use of Non-IFRS Measures" and "Reconciliation of IFRS to Non-IFRS Results" for additional information.
8View entire presentation