Commercial Metals Company Investor Presentation Deck
Structure Type % of Market Segment
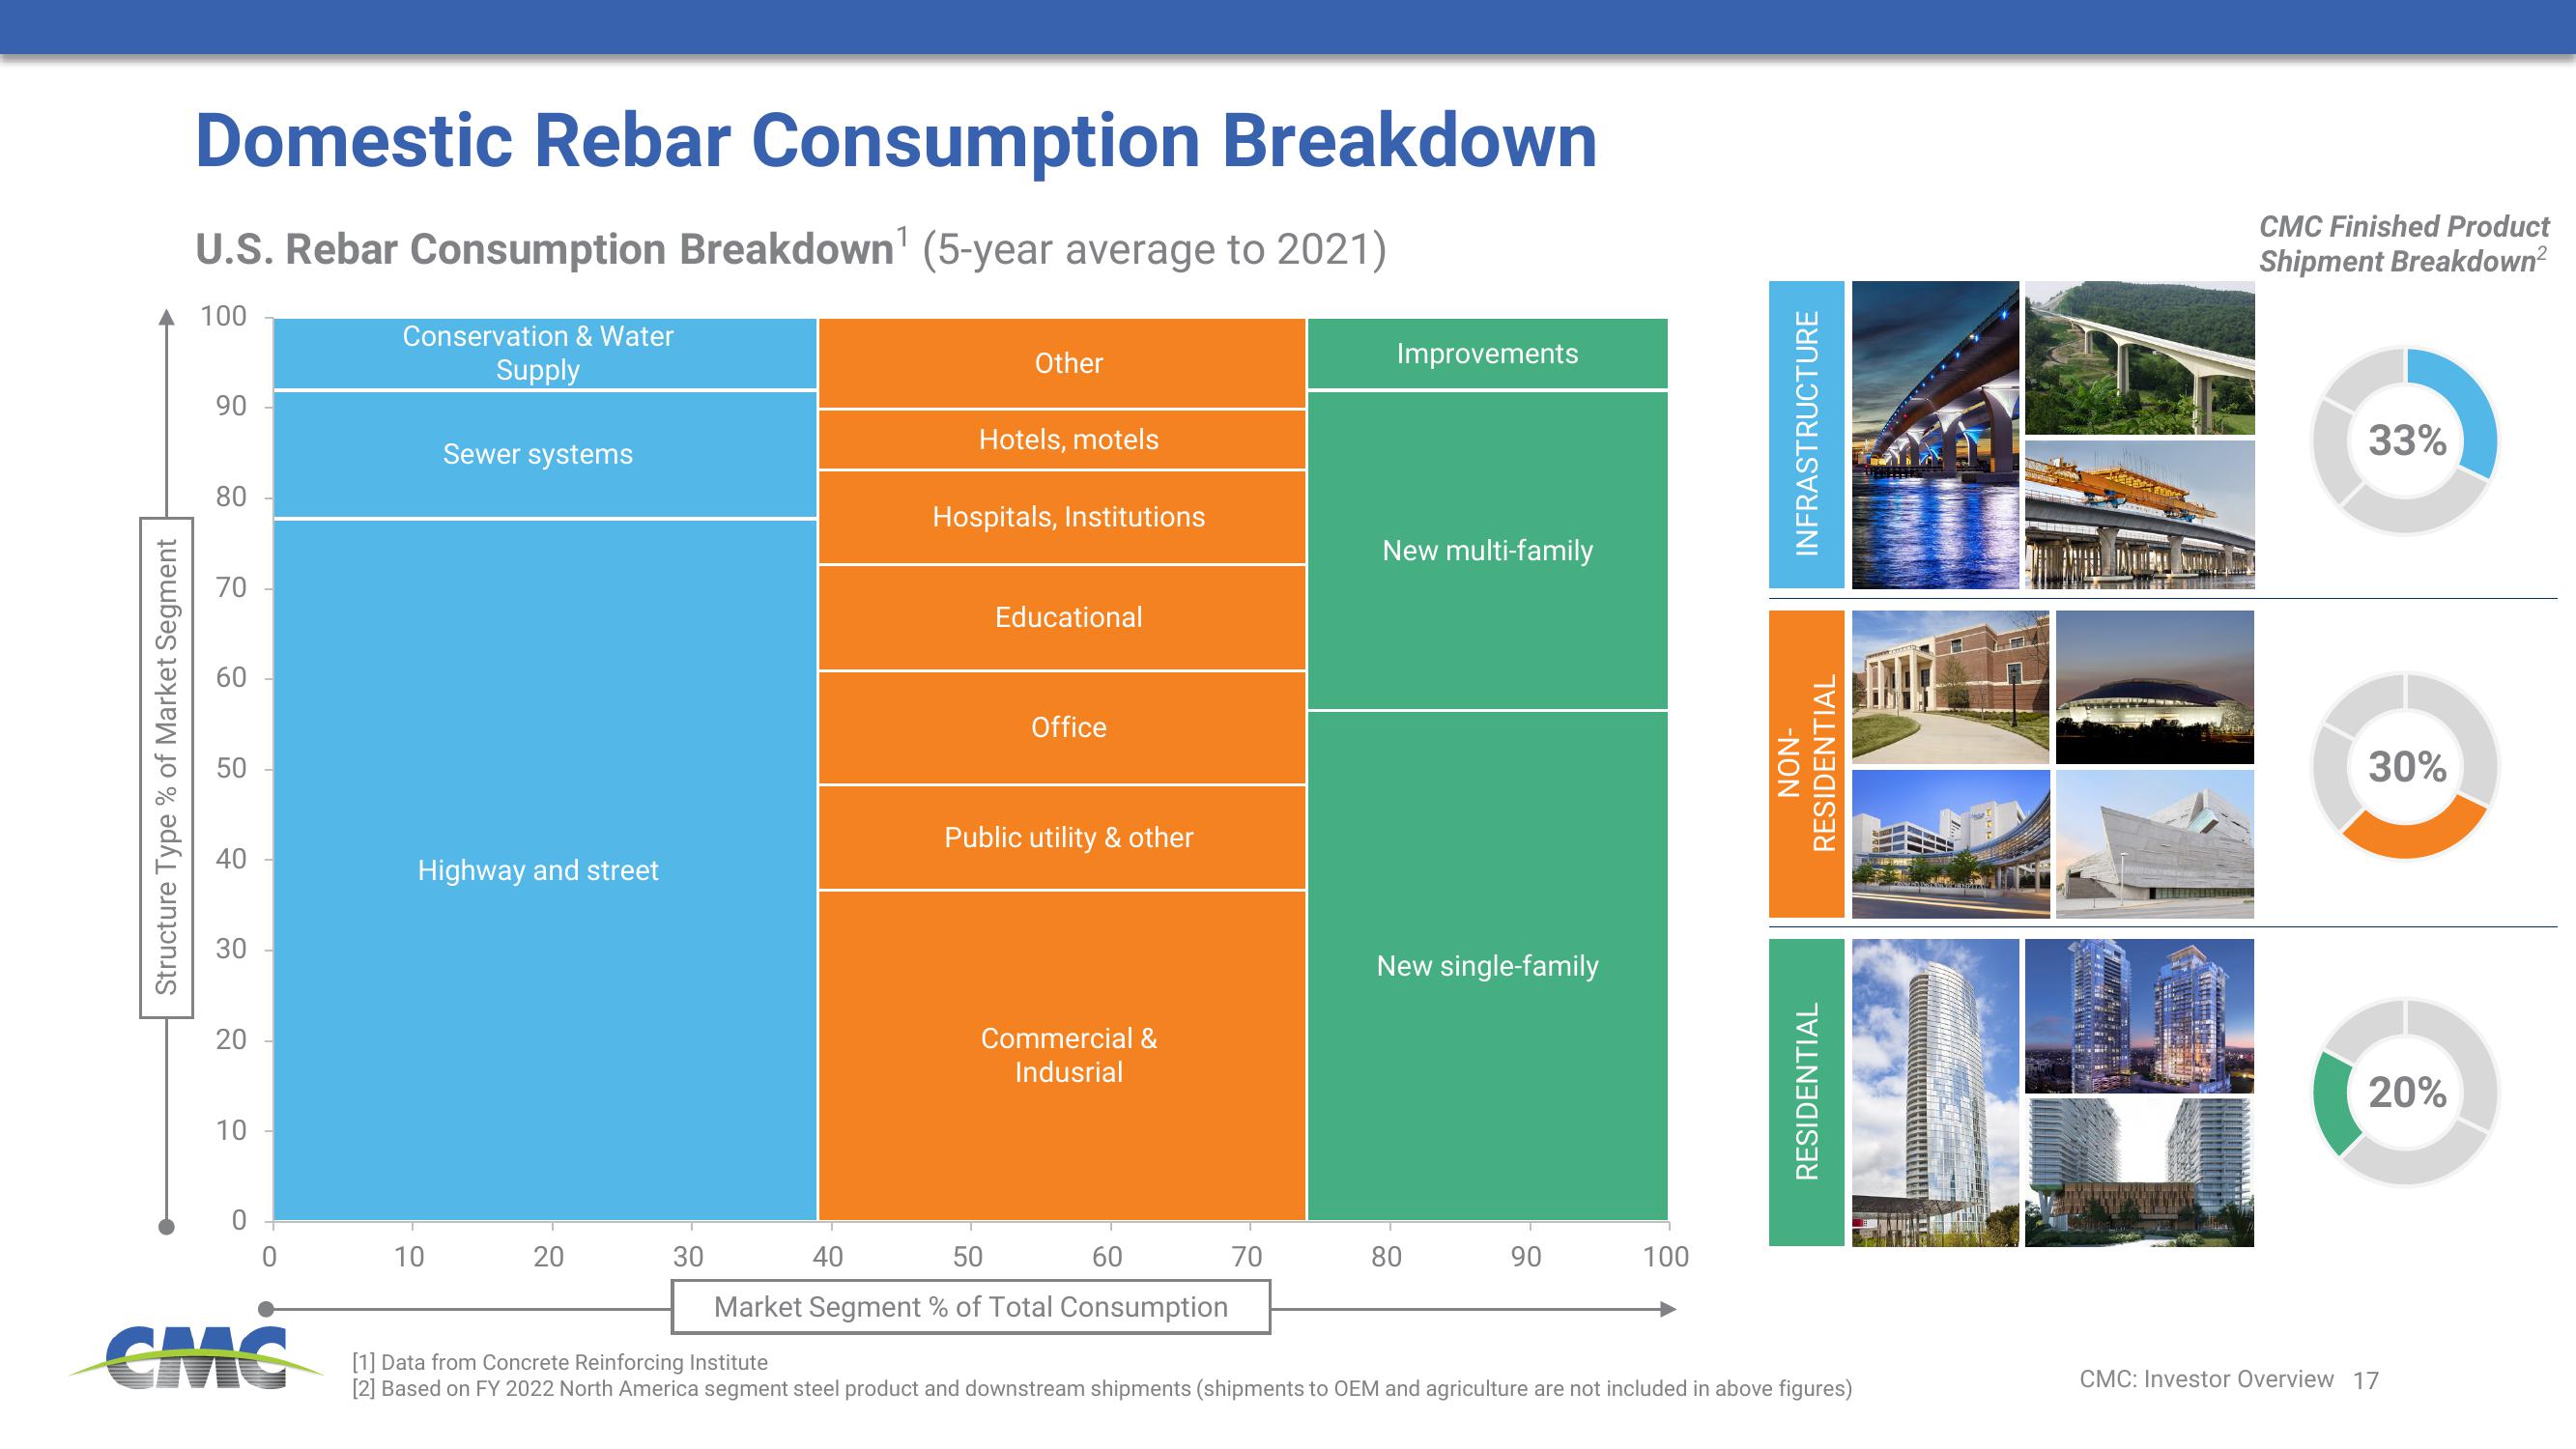
Domestic Rebar Consumption Breakdown
U.S. Rebar Consumption Breakdown¹ (5-year average to 2021)
100
90
80
70
60
50
40
30
20
10
0
CMC
Conservation & Water
Supply
Sewer systems
Highway and street
10
20
30
40
Other
Hotels, motels
Hospitals, Institutions
Educational
Office
Public utility & other
Commercial &
Indusrial
50
Market Segment % of Total Consumption
60
70
Improvements
New multi-family
New single-family
80
90
100
INFRASTRUCTURE
-NON
RESIDENTIAL
RESIDENTIAL
[1] Data from Concrete Reinforcing Institute
[2] Based on FY 2022 North America segment steel product and downstream shipments (shipments to OEM and agriculture are not included in above figures)
LE
CMC Finished Product
Shipment Breakdown²
33%
30%
20%
CMC: Investor Overview 17View entire presentation