Solid Power SPAC Presentation Deck
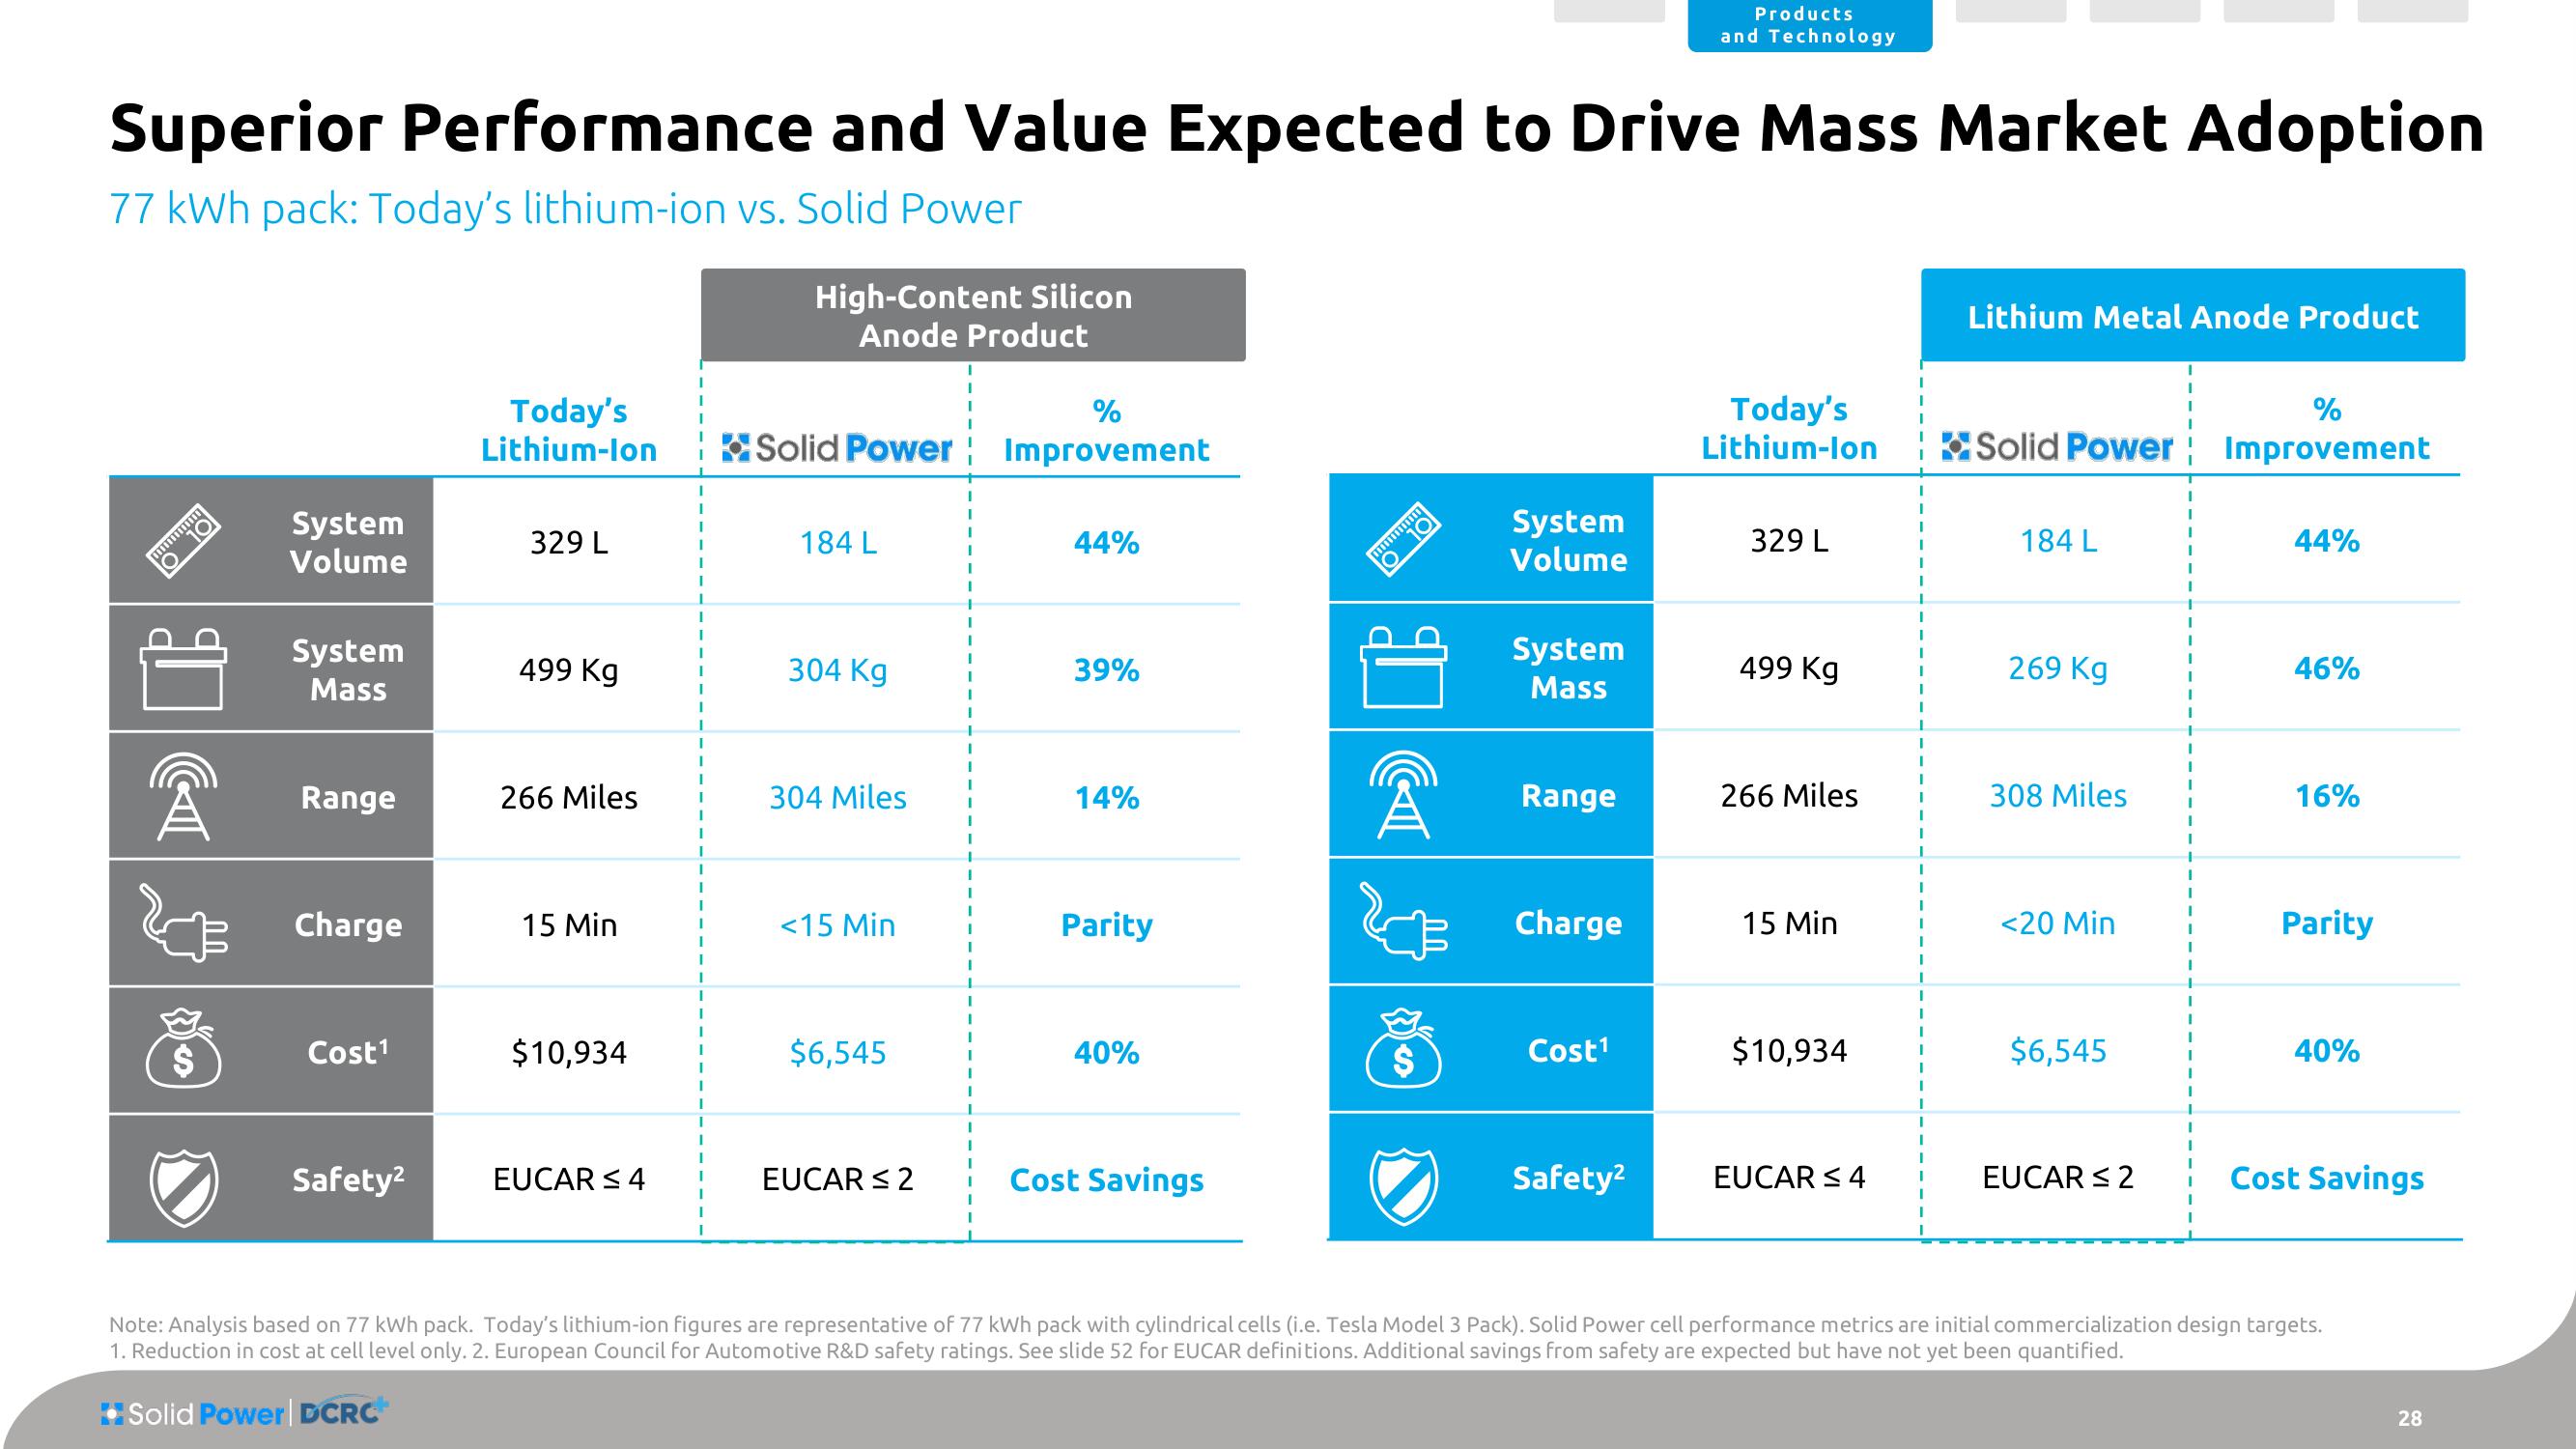
Superior Performance and Value Expected to Drive Mass Market Adoption
77 kWh pack: Today's lithium-ion vs. Solid Power
*************
10
$
System
Volume
System
Mass
Range
Charge
Cost¹
Safety²
Today's
Lithium-Ion
329 L
499 Kg
266 Miles
15 Min
$10,934
EUCAR ≤ 4
I
I
I
1
I
High-Content Silicon
Anode Product
%
Solid Power Improvement
184 L
304 Kg
304 Miles
<15 Min
$6,545
EUCAR ≤ 2
I
I
I
I
1
1
I
T
I
I
I
I
I
I
I
I
I
I
I
I
I
I
I
I
I
I
44%
39%
14%
Parity
40%
Cost Savings
*******
P
$
System
Volume
System
Mass
Range
Charge
Cost¹
Products
and Technology
Safety²
Today's
hium-Ion
329 L
499 Kg
266 Miles
15 Min
$10,934
EUCAR ≤ 4
1
1
1
1
1
I
I
1
I
1
I
1
1
I
1
1
I
I
I
I
I
I
Lithium Metal Anode Product
%
Solid Power Improvement
184 L
269 Kg
308 Miles
<20 Min
$6,545
EUCAR ≤ 2
I
I
1
I
44%
46%
16%
Parity
40%
Cost Savings
Note: Analysis based on 77 kWh pack. Today's lithium-ion figures are representative of 77 kWh pack with cylindrical cells (i.e. Tesla Model 3 Pack). Solid Power cell performance metrics are initial commercialization design targets.
1. Reduction in cost at cell level only. 2. European Council for Automotive R&D safety ratings. See slide 52 for EUCAR definitions. Additional savings from safety are expected but have not yet been quantified.
Solid Power DCRC
28View entire presentation