dLocal Results Presentation Deck
Adjusted
EBITDA
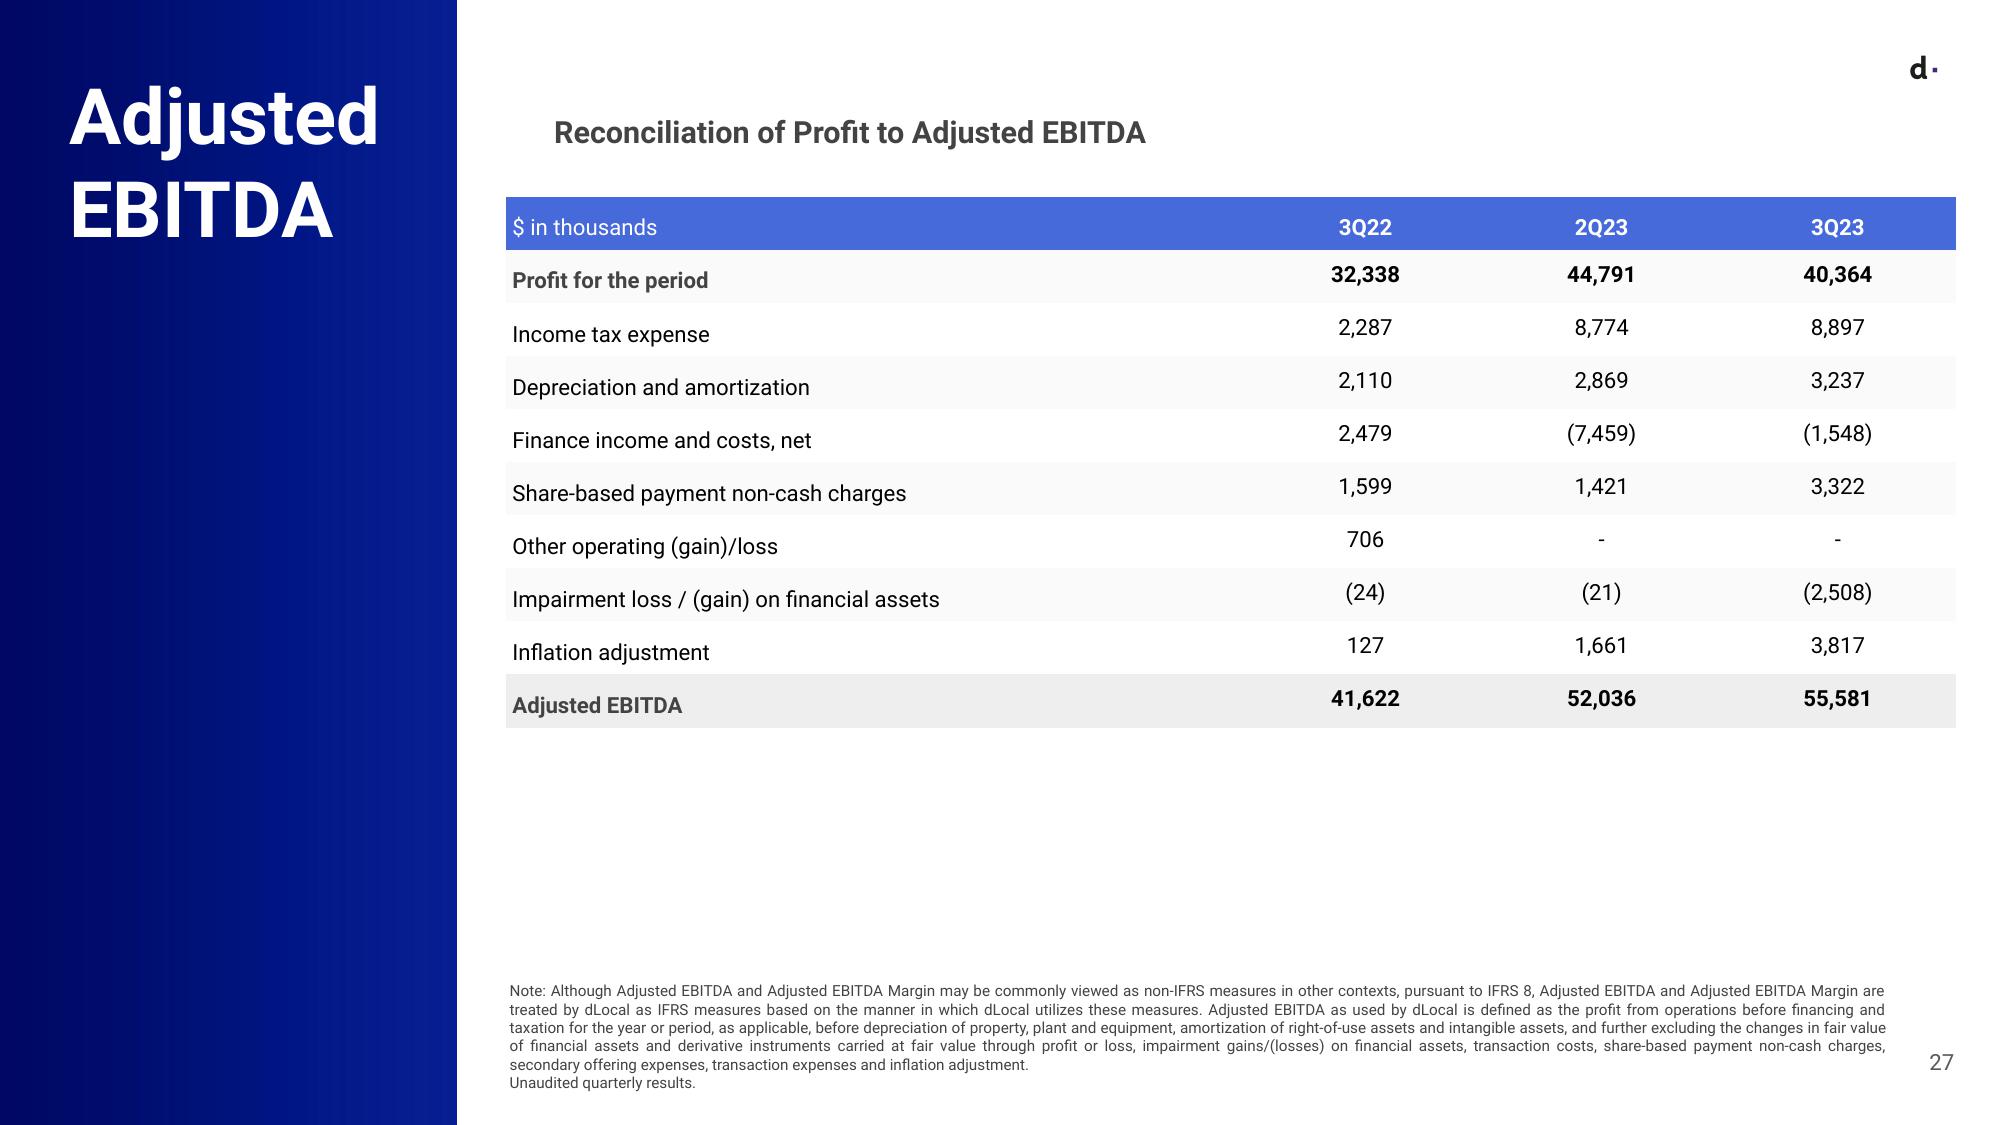
Reconciliation of Profit to Adjusted EBITDA
$ in thousands
Profit for the period
Income tax expense
Depreciation and amortization
Finance income and costs, net
Share-based payment non-cash charges
Other operating (gain)/loss
Impairment loss/ (gain) on financial assets
Inflation adjustment
Adjusted EBITDA
3Q22
32,338
2,287
2,110
2,479
1,599
706
(24)
127
41,622
2Q23
44,791
8,774
2,869
(7,459)
1,421
(21)
1,661
52,036
3Q23
40,364
8,897
3,237
(1,548)
3,322
(2,508)
3,817
55,581
Note: Although Adjusted EBITDA and Adjusted EBITDA Margin may be commonly viewed as non-IFRS measures in other contexts, pursuant to IFRS 8, Adjusted EBITDA and Adjusted EBITDA Margin are
treated by dLocal as IFRS measures based on the manner in which dLocal utilizes these measures. Adjusted EBITDA as used by dLocal is defined as the profit from operations before financing and
taxation for the year or period, as applicable, before depreciation of property, plant and equipment, amortization of right-of-use assets and intangible assets, and further excluding the changes in fair value
of financial assets and derivative instruments carried at fair value through profit or loss, impairment gains/(losses) on financial assets, transaction costs, share-based payment non-cash charges,
secondary offering expenses, transaction expenses and inflation adjustment.
Unaudited quarterly results.
d.
27View entire presentation