First Busey Results Presentation Deck
2Q23 Earnings Investor Presentation
Granular, Stable Deposit Base
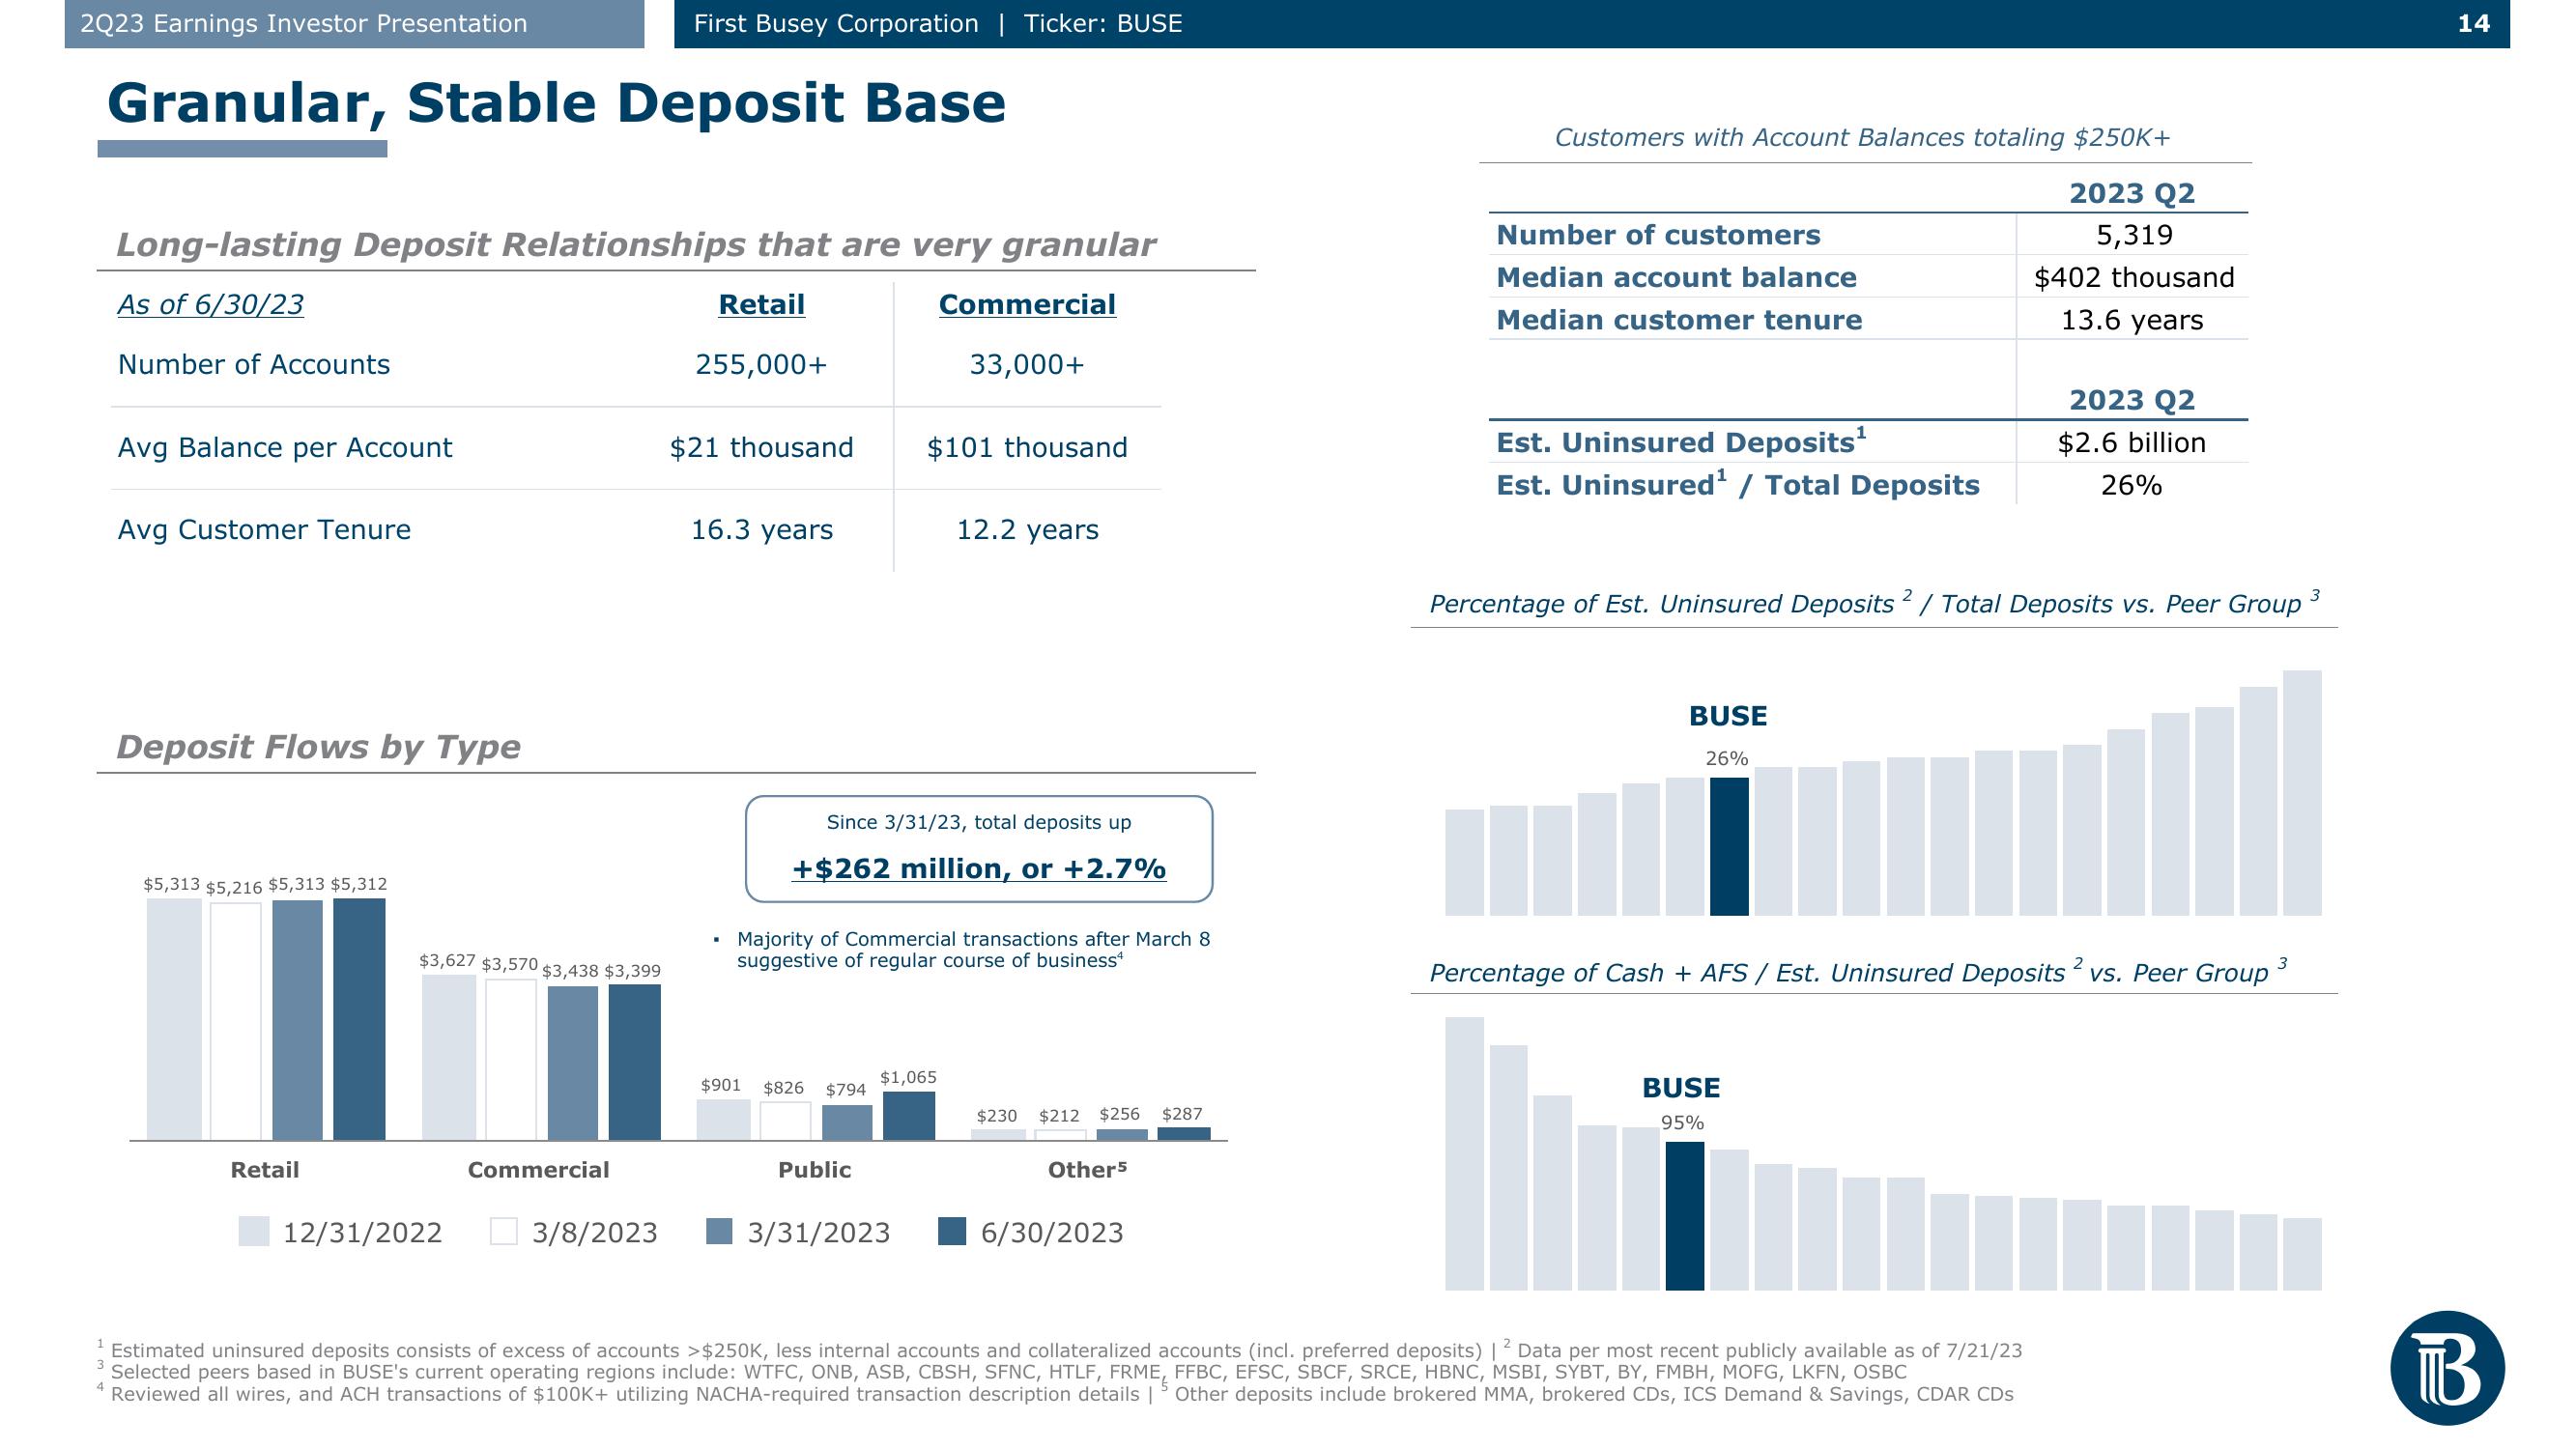
Long-lasting Deposit Relationships that are very granular
As of 6/30/23
Retail
Number of Accounts
255,000+
Avg Balance per Account
Avg Customer Tenure
Deposit Flows by Type
$5,313 $5,216 $5,313 $5,312
Retail
$3,627 $3,570 $3,438 $3,399
12/31/2022
First Busey Corporation | Ticker: BUSE
Commercial
3/8/2023
$21 thousand
16.3 years
$901
$826 $794
Since 3/31/23, total deposits up
+$262 million, or +2.7%
Majority of Commercial transactions after March 8
suggestive of regular course of business4
Public
Commercial
33,000+
$101 thousand
$1,065
3/31/2023
12.2 years
$230 $212 $256 $287
Other5
6/30/2023
Customers with Account Balances totaling $250K+
2023 Q2
5,319
$402 thousand
13.6 years
Number of customers
Median account balance
Median customer tenure
Est. Uninsured Deposits¹
Est. Uninsured¹ / Total Deposits
II
3
Percentage of Est. Uninsured Deposits 2 / Total Deposits vs. Peer Group ³
BUSE
26%
2023 Q2
$2.6 billion
26%
Percentage of Cash + AFS / Est. Uninsured Deposits 2 vs. Peer Group
BUSE
95%
¹ Estimated uninsured deposits consists of excess of accounts >$250K, less internal accounts and collateralized accounts (incl. preferred deposits) | 2 Data per most recent publicly available as of 7/21/23
Selected peers based in BUSE's current operating regions include: WTFC, ONB, ASB, CBSH, SFNC, HTLF, FRME, FFBC, EFSC, SBCF, SRCE, HBNC, MSBI, SYBT, BY, FMBH, MOFG, LKFN, OSBC
Reviewed all wires, and ACH transactions of $100K+ utilizing NACHA-required transaction description details | Other deposits include brokered MMA, brokered CDs, ICS Demand & Savings, CDAR CDs
3
14
BView entire presentation