PB Bankshares Results Presentation Deck
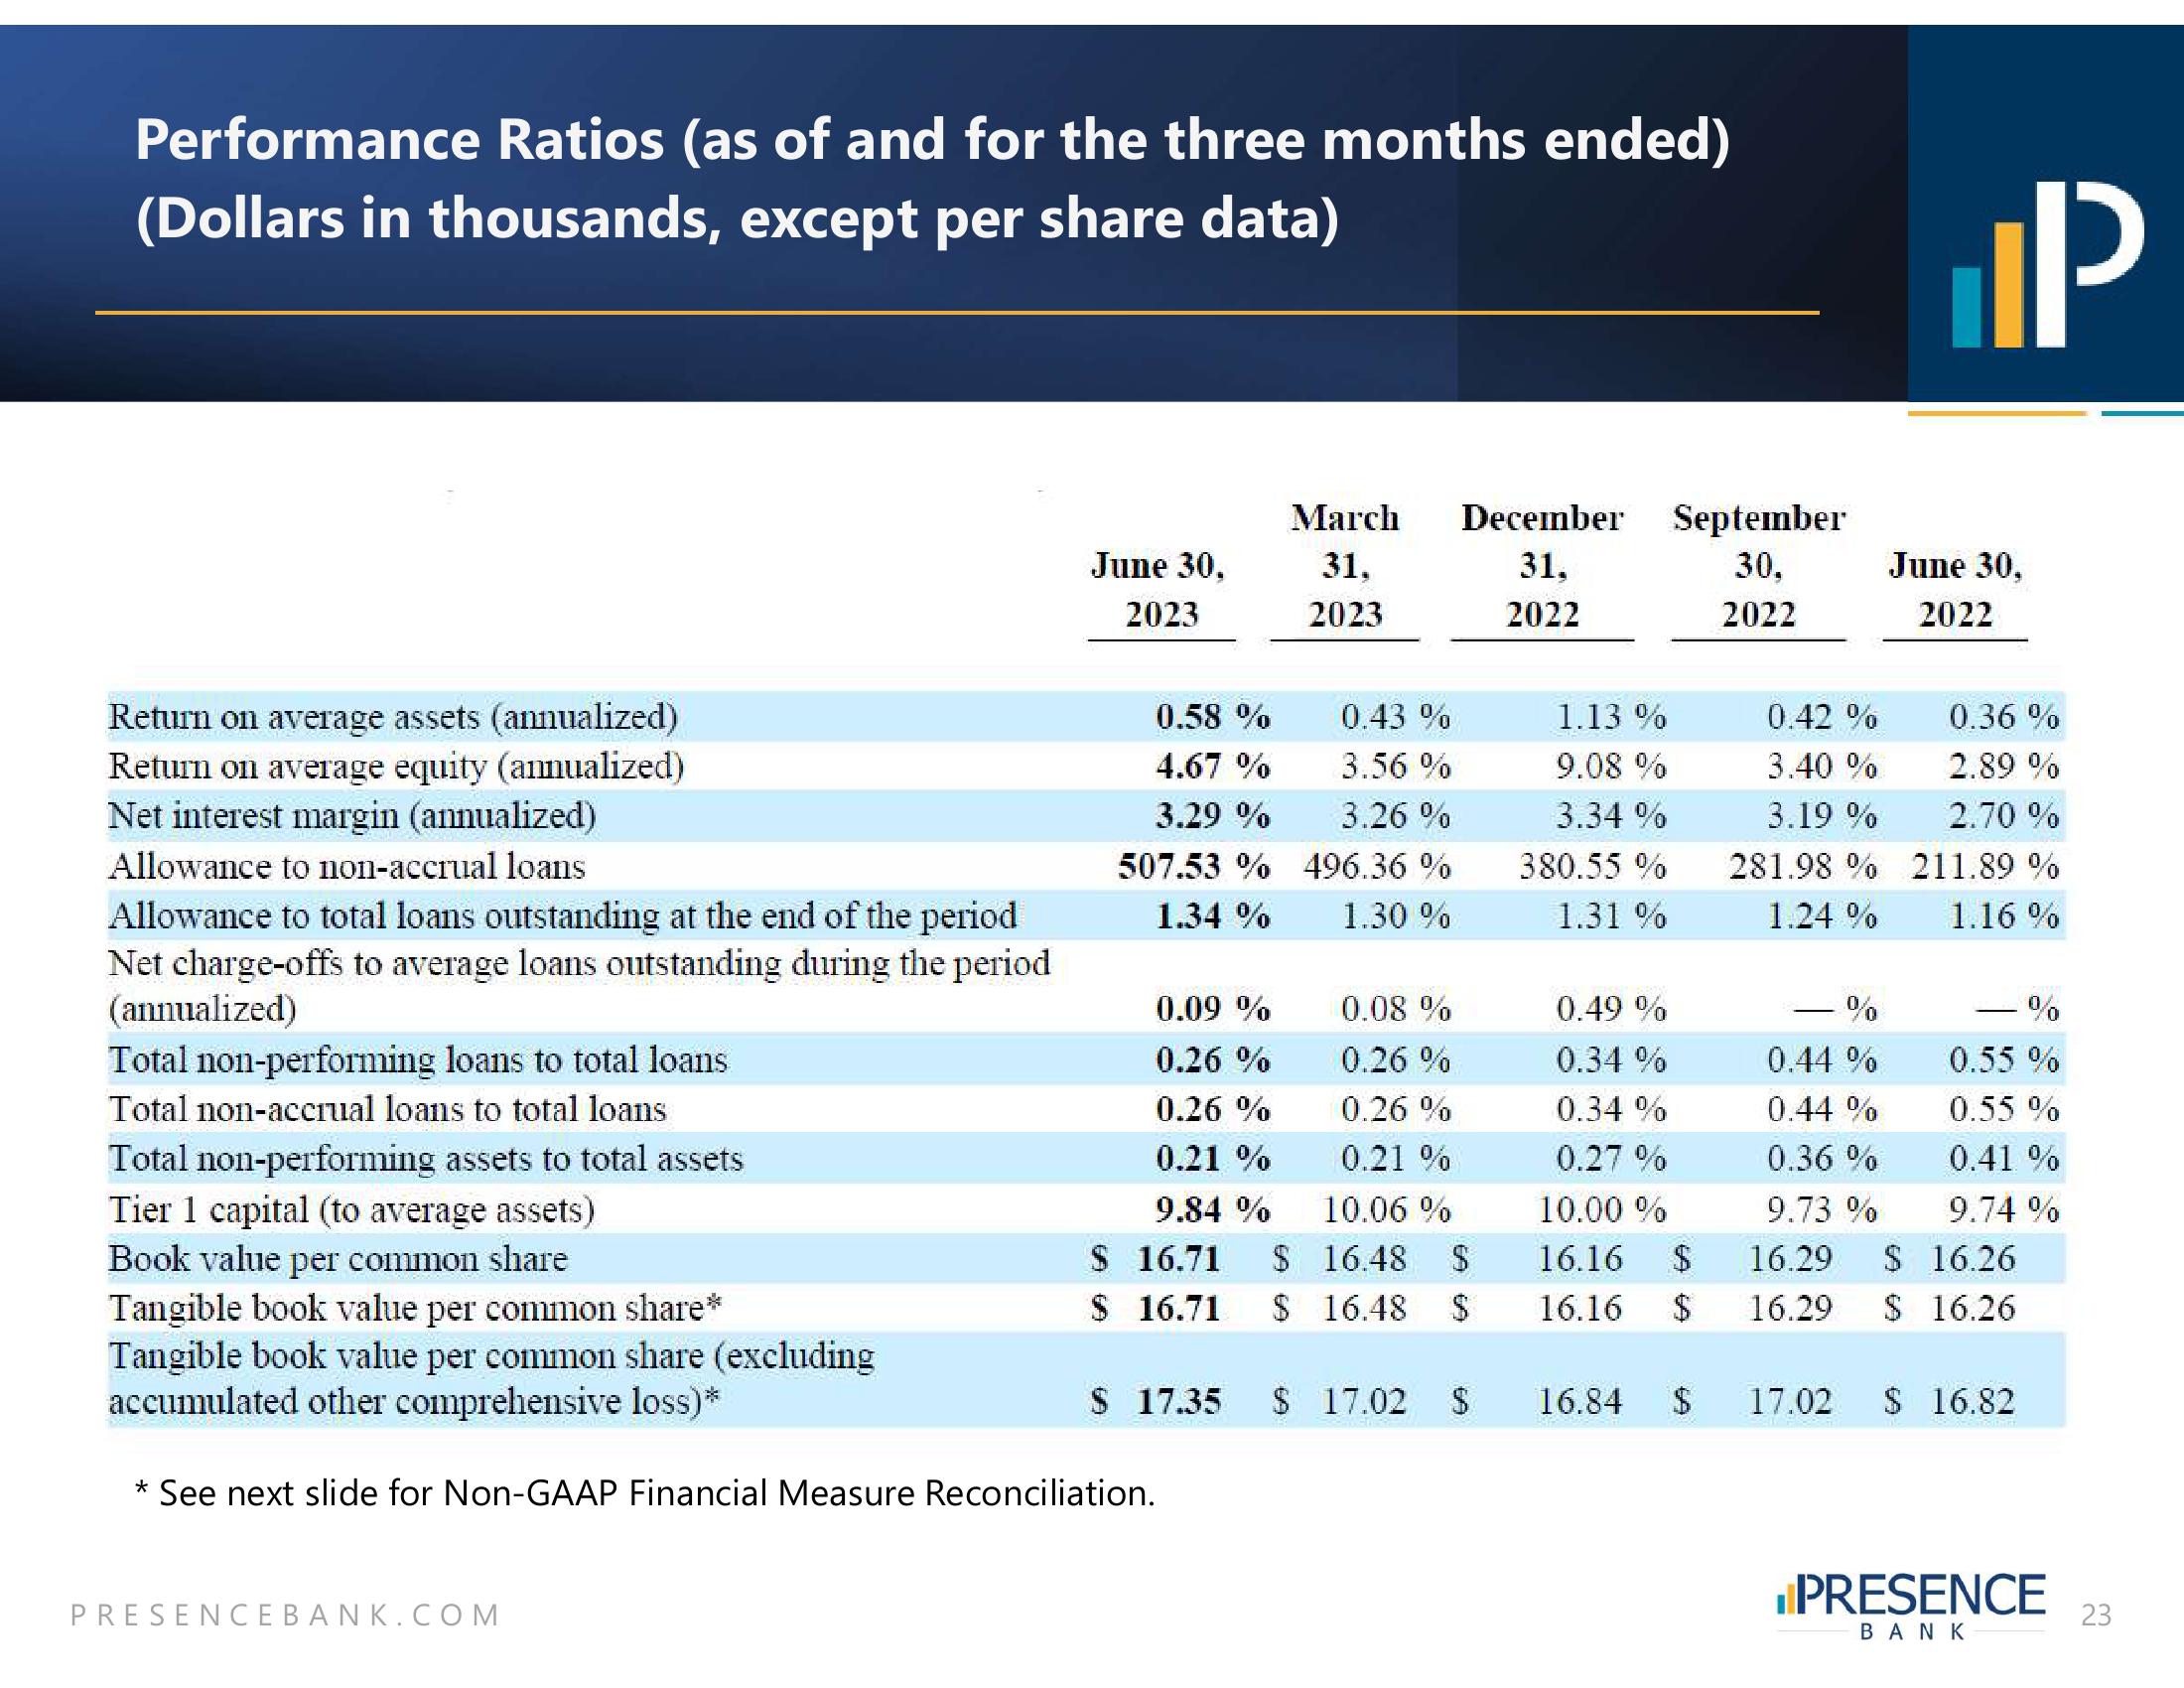
Performance Ratios (as of and for the three months ended)
(Dollars in thousands, except per share data)
Return on average assets (annualized)
Return on average equity (annualized)
Net interest margin (annualized)
Allowance to non-accrual loans
Allowance to total loans outstanding at the end of the period
Net charge-offs to average loans outstanding during the period
(annualized)
Total non-performing loans to total loans.
Total non-accrual loans to total loans
Total non-performing assets to total assets
Tier 1 capital (to average assets)
Book value per common share
Tangible book value per common share*
Tangible book value per common share (excluding
accumulated other comprehensive loss)*
June 30,
2023
PRESENCEBANK.COM
$
$
0.58 %
4.67 %
3.29 %
507.53 %
1.34 %
March December
31.
31.
2022
2023
* See next slide for Non-GAAP Financial Measure Reconciliation.
0.43 %
3.56%
3.26%
496.36 %
1.30 %
0.09 %
0.08 %
0.26 %
0.26 %
0.26 %
0.26 %
0.21 %
10.06%
0.21 %
9.84 %
16.71 $ 16.48 $
16.71 $ 16.48 $
$ 17.35 $ 17.02
$
1.13%
9.08 %
3.34 %
380.55 %
1.31 %
September
30,
2022
0.49 %
0.34 %
0.34%
0.27 %
10.00 %
16.16 $
16.16 $
16.84 $
0.42 %
3.40%
3.19 %
281.98 %
1.24 %
כןן
June 30,
2022
0.36 %
2.89 %
2.70 %
211.89 %
1.16%
%
0.44 %
0.44 %
0.36 %
9.73 %
16.29 $ 16.26
16.29 $ 16.26
%
0.55 %
0.55 %
0.41 %
9.74 %
17.02 $ 16.82
PRESENCE
ΒΑΝΚ
23View entire presentation