Credit Suisse Investment Banking Pitch Book
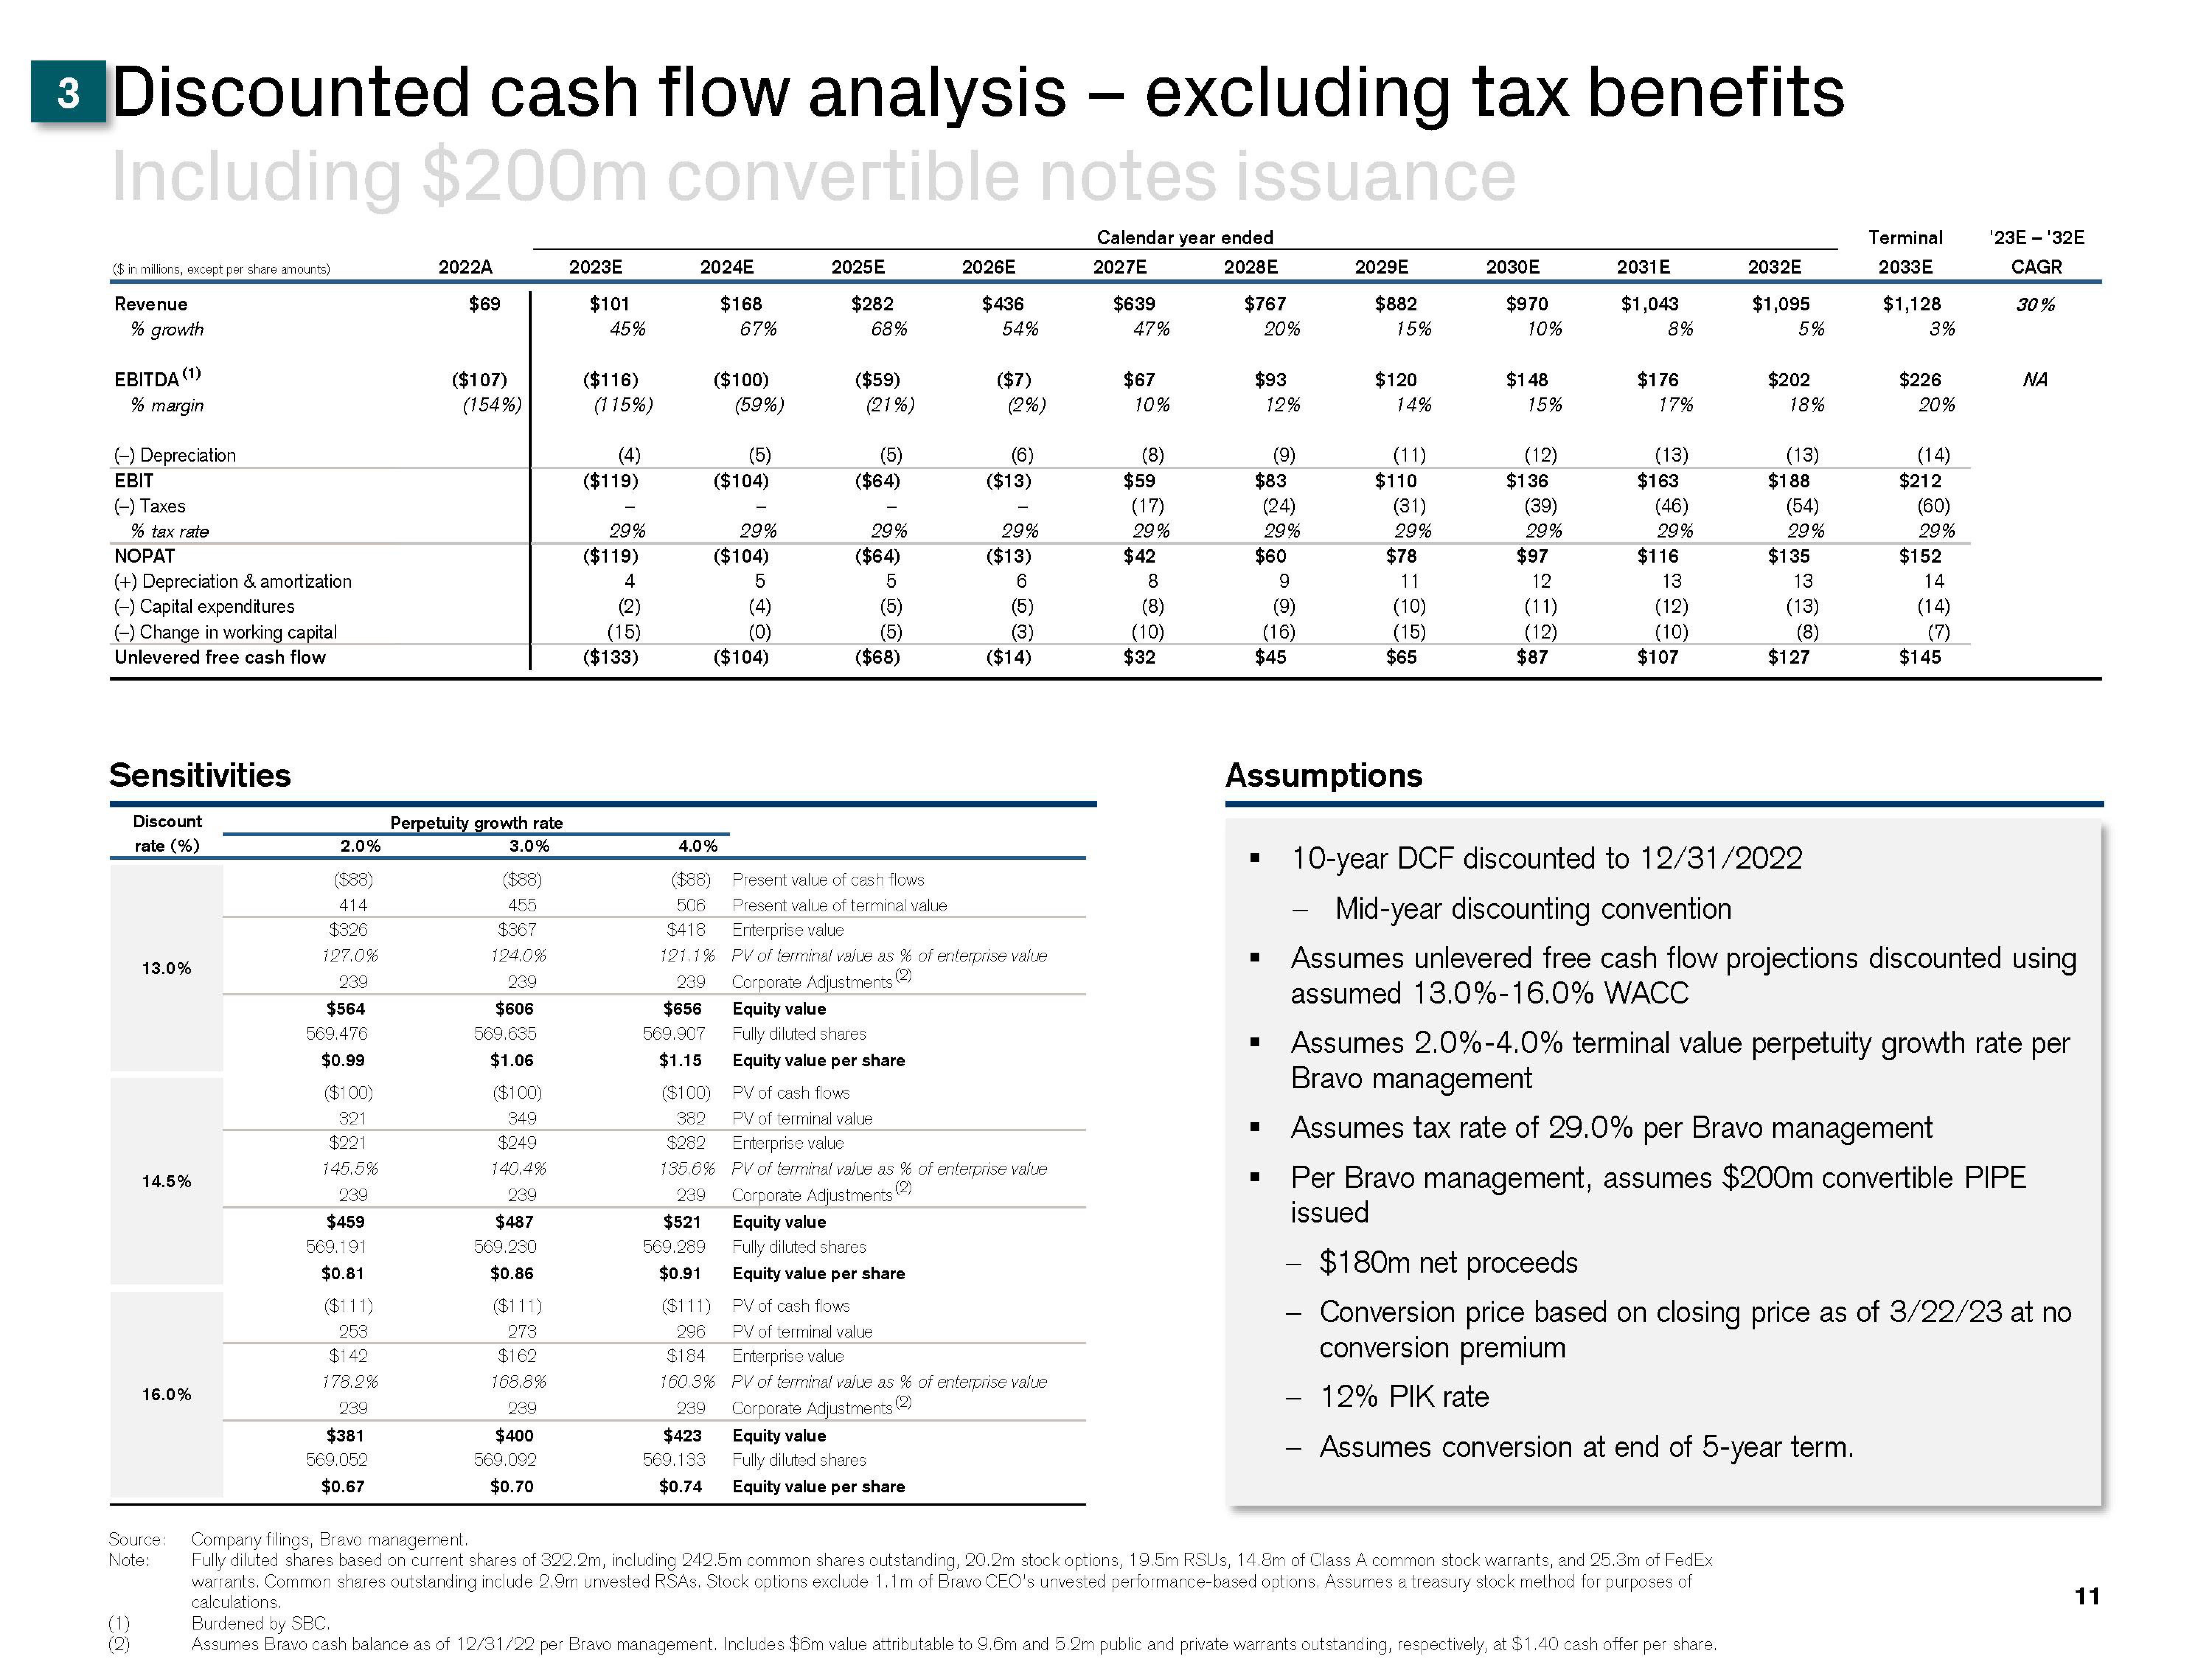
3 Discounted cash flow analysis - excluding tax benefits
Including $200m convertible notes issuance
Calendar year ended
2027E
2028E
($ in millions, except per share amounts)
Revenue
% growth
(1)
% margin
EBITDA
(-) Depreciation
EBIT
(-) Taxes
% tax rate
NOPAT
(+) Depreciation & amortization
(-) Capital expenditures
(-) Change in working capital
Unlevered free cash flow
Sensitivities
Discount
rate (%)
(1)
(2)
13.0%
14.5%
16.0%
Source:
Note:
2.0%
($88)
414
$326
127.0%
239
$564
569.476
$0.99
($100)
321
$221
145.5%
239
$459
569.191
$0.81
($111)
253
$142
178.2%
239
$381
569.052
$0.67
2022A
$69
($107)
(154%)
Perpetuity growth rate
3.0%
($88)
455
$367
124.0%
239
$606
569.635
$1.06
($100)
349
$249
140.4%
239
$487
569.230
$0.86
($111)
273
$162
168.8%
239
$400
569.092
$0.70
2023E
$101
45%
($116)
(115%)
(4)
($119)
29%
($119)
4
(2)
(15)
($133)
2024E
$168
67%
($111)
296
$184
($100)
(59%)
(5)
($104)
29%
($104)
5
(4)
(0)
($104)
2025E
$282
68%
($59)
(21%)
(5)
($64)
29%
($64)
5
(5)
(5)
($68)
Equity value per share
2026E
PV of cash flows
PV of terminal value
$436
54%
$423 Equity value
569.133 Fully diluted shares
$0.74 Equity value per share
($7)
(2%)
4.0%
($88) Present value of cash flows
506
Present value of terminal value
$418
Enterprise value
121.1% PV of terminal value as % of enterprise value
239 Corporate Adjustments (2)
$656
Equity value
569.907 Fully diluted shares
$1.15
(6)
($13)
29%
($100)
382
$282 Enterprise value
135.6% PV of terminal value as % of enterprise value
(2)
239 Corporate Adjustments
$521
Equity value
569.289 Fully diluted shares
$0.91 Equity value per share
($13)
6
(5)
(3)
($14)
PV of cash flows
PV of terminal value
Enterprise value
160.3% PV of terminal value as % of enterprise value
239 Corporate Adjustments (2)
$639
47%
$67
10%
(8)
$59
(17)
29%
$42
8
(8)
(10)
$32
$767
$93
20%
$83
■
12%
$60
(9)
(24)
29%
■
I
$45
■
9
(9)
(16)
2029E
$882
-
15%
$120
14%
(11)
Assumptions
$110
(31)
29%
$78
11
(10)
(15)
$65
2030E
$970
10%
$148
15%
(12)
$136
(39)
29%
$97
12
(11)
(12)
$87
2031E
$1,043
8%
$176
17%
(13)
$163
(46)
29%
$116
13
(12)
(10)
$107
2032E
$1,095
5%
$202
18%
(13)
Company filings, Bravo management.
Fully diluted shares based on current shares of 322.2m, including 242.5m common shares outstanding, 20.2m stock options, 19.5m RSUS, 14.8m of Class A common stock warrants, and 25.3m of FedEx
warrants. Common shares outstanding include 2.9m unvested RSAs. Stock options exclude 1.1m of Bravo CEO's unvested performance-based options. Assumes a treasury stock method for purposes of
calculations.
Burdened by SBC.
Assumes Bravo cash balance as of 12/31/22 per Bravo management. Includes $6m value attributable to 9.6m and 5.2m public and private warrants outstanding, respectively, at $1.40 cash offer per share.
$188
(54)
29%
$135
13
(13)
(8)
10-year DCF discounted to 12/31/2022
Mid-year discounting convention
$127
Terminal
2033E
$1,128
3%
$226
20%
(14)
$212
(60)
29%
$152
14
(14)
(7)
$145
'23E-¹32E
CAGR
30%
ΝΑ
Assumes unlevered free cash flow projections discounted using
assumed 13.0%-16.0% WACC
Assumes 2.0% -4.0% terminal value perpetuity growth rate per
Bravo management
Assumes tax rate of 29.0% per Bravo management
Per Bravo management, assumes $200m convertible PIPE
issued
- $180m net proceeds
Conversion price based on closing price as of 3/22/23 at no
conversion premium
12% PIK rate
Assumes conversion at end of 5-year term.
11View entire presentation