Bank of America Investment Banking Pitch Book
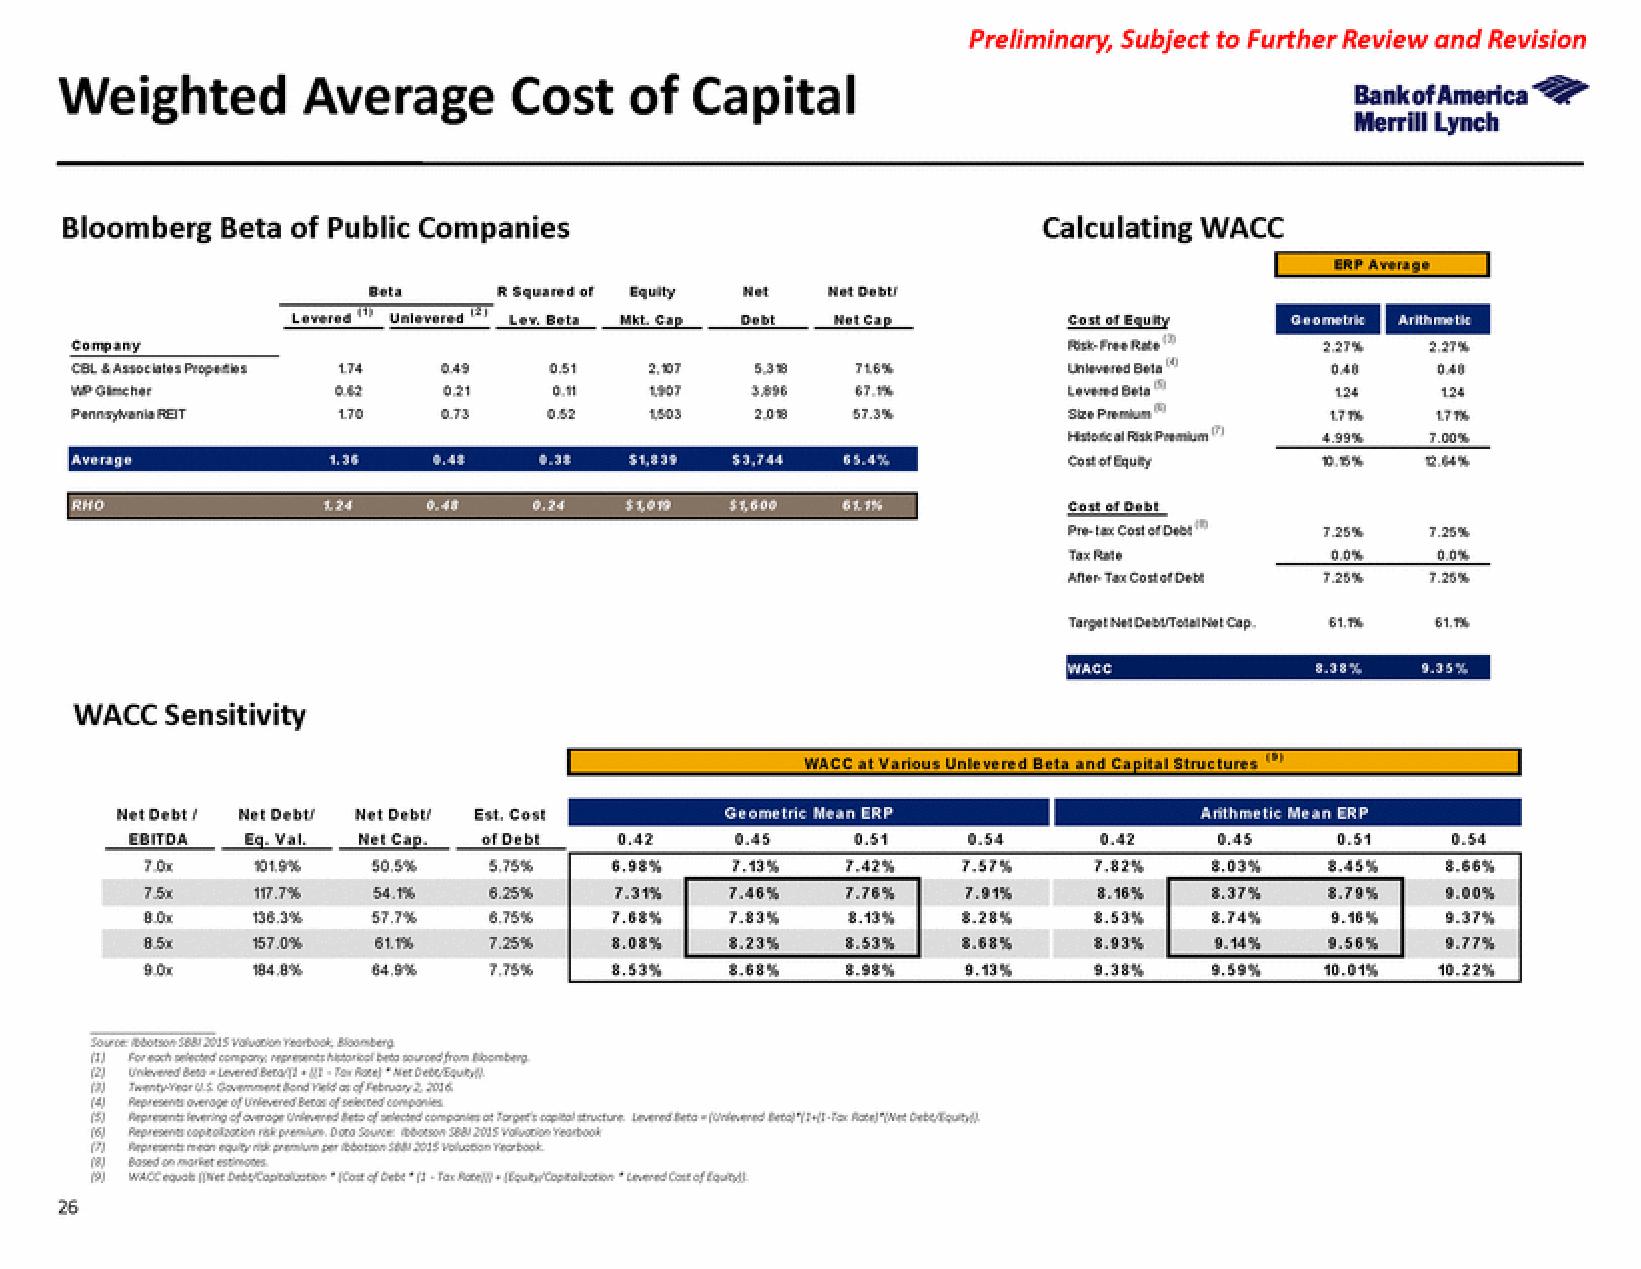
Weighted Average Cost of Capital
Bloomberg Beta of Public Companies
R Squared of
Lev. Beta
Company
CBL & Associates Properties
WP Gicher
Pennsylvania REIT
Average
RHO
WACC Sensitivity
26
Net Debt/
EBITDA
7.0x
7.5x
8.0x
8.5x
9.0x
******
Levered
Net Debt/
Eq. Val.
101.9%
117.7%
136.3%
157.0%
184.8%
174
(8) Based on market estimates
1.70
1.24
Beta
Unlevered
Net Debt!
Net Cap.
50.5%
54.1%
57.7%
61.1%
64.9%
0.21
0.73
0.48
WACC equalse DebCapitaluation (Cost of Debe
121
Source:boton 5881 2015 valvonion Yearbook, Bloomberg
(11
For each selected company represents historical beta sourced from bomberg
(2) Unlevered BetLevered Beta-Fox Rate)*Net Debc/Equity
(3) TwentyYear Govemment Bond Field as of February 2, 2016
(4) Represents overage of Unlevered Betos of selected companies
Est. Cost
of Debt
5.75%
6.75%
7.25%
7.75%
0.51
0.11
0.52
Equity
Mkt. Cap
2,107
1503
$1,839
$1019
0.42
6.98%
7.31%
7.68%
8.53%
Het
Debt
2.08
$3,744
$1,600
Net Debt
0.45
7.13%
7.46%
7.83%
8.23%
8.68%
Net Cap
716%
67.14
57.3%
65.4%
61,3%
Geometric Mean ERP
0.51
7.42%
7.76%
8.13%
8.53%
Preliminary, Subject to Further Review and Revision
Bank of America
Merrill Lynch
0.54
7.57%
7.91%
8.28%
(5) Represents levering of overage Univered Betoof selected companies at Torpet's capital structure. Levered Betanlevered Betal"+1-Tax Ratel "We Debout
boton 588 2015 volvotion Yearbook
Represents copolization rak premium, Doro Source
Represente equity nik premium person
2015 voluton Yearbook
(3-Tax Rate EquityCapitaluation Levered Cost of Equit
9.13%
Calculating WACC
Cost of Equity
Fisk-Free Rate
Unlevered Beta
Levered Beta
Size Premium
Hatorical Risk Premium 11
Cost of Equity
Cost of Debt
Pre-tax Cost of Debt
WACC at Various Unlevered Beta and Capital Structures
Tax Rate
After Tax Cost of Deb
Target NetDebiTotal Net Cap.
WACC
0.42
7.82%
8.16%
8.53%
8.93%
9.38%
(D)
9.14%
9.59%
ERP Average
Geometric Arithmetic
0.48
124
1.77%
4.99%
10.15%
7.25%
0.0%
7.25%
61.7%
8.38%
Arithmetic Mean ERP
0.45
0.51
8.03%
8.37%
8.45%
8.79%
9.16%
9.56%
10.01%
0.40
124
1.71%
7.00%
2.44%
7.25%
0.0%
7.25%
61.7%
9.35%
0.54
9.00%
9.37%
9.77%
10.22%View entire presentation