TPG Results Presentation Deck
Non-GAAP Financial Measures
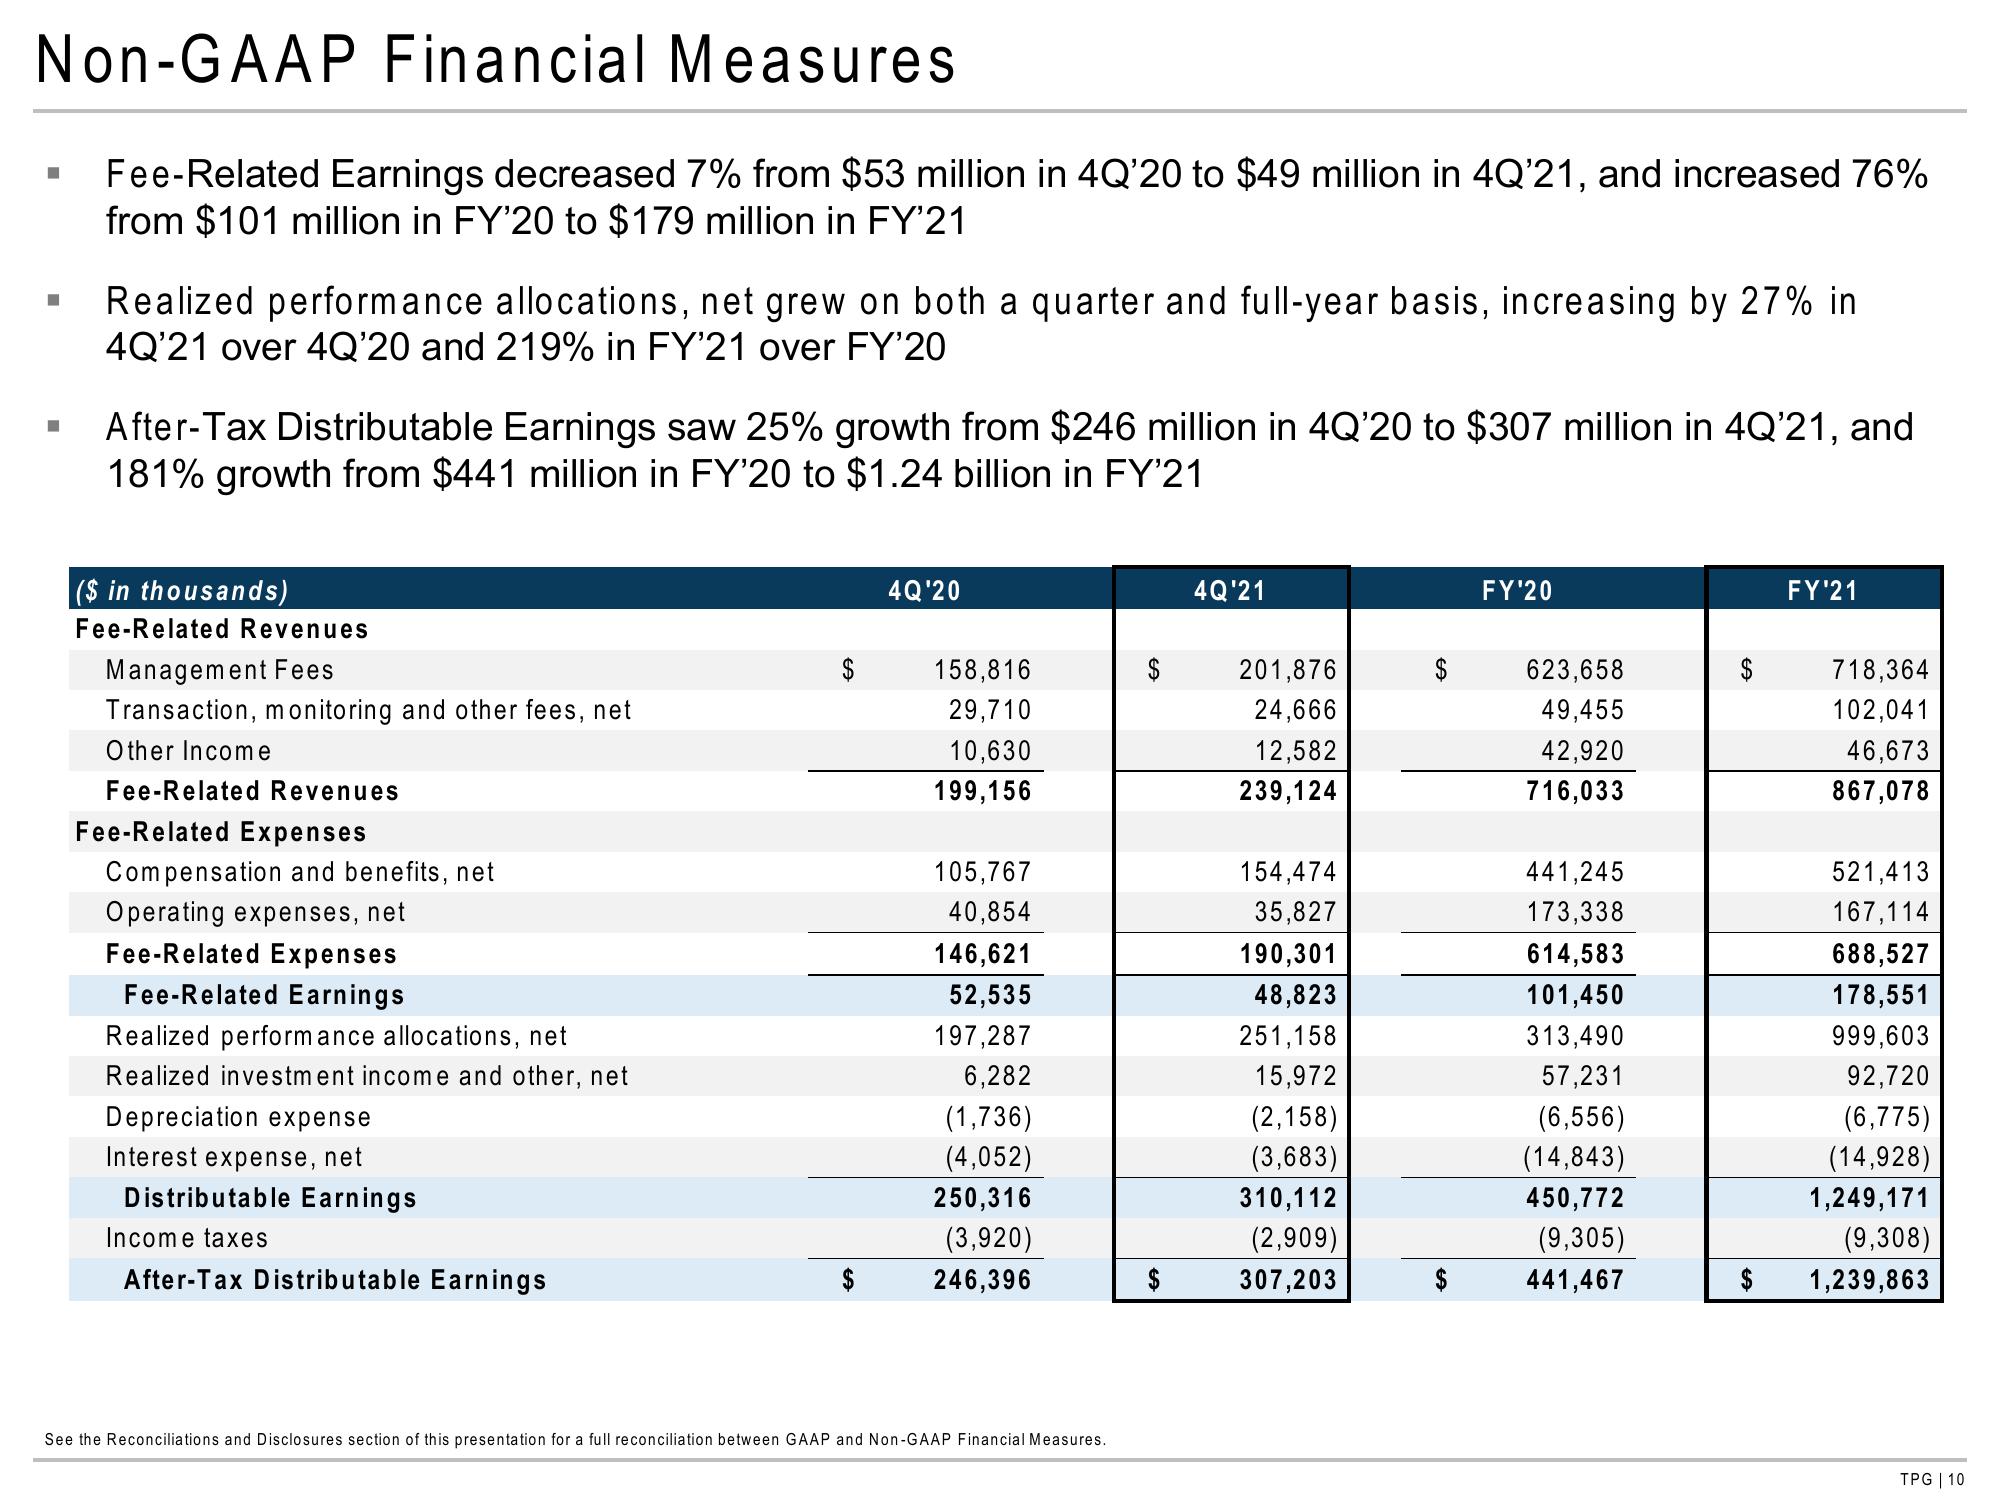
Fee-Related Earnings decreased 7% from $53 million in 4Q'20 to $49 million in 4Q'21, and increased 76%
from $101 million in FY'20 to $179 million in FY'21
■
■
■
Realized performance allocations, net grew on both a quarter and full-year basis, increasing by 27% in
4Q'21 over 4Q'20 and 219% in FY'21 over FY'20
After-Tax Distributable Earnings saw 25% growth from $246 million in 4Q'20 to $307 million in 4Q'21, and
181% growth from $441 million in FY'20 to $1.24 billion in FY'21
($ in thousands)
Fee-Related Revenues
Management Fees
Transaction, monitoring and other fees, net
Other Income
Fee-Related Revenues
Fee-Related Expenses
Compensation and benefits, net
Operating expenses, net
Fee-Related Expenses
Fee-Related Earnings
Realized performance allocations, net
Realized investment income and other, net
Depreciation expense
Interest expense, net
Distributable Earnings
Income taxes
After-Tax Distributable Earnings
4Q'20
158,816
29,710
10,630
199,156
105,767
40,854
146,621
52,535
197,287
6,282
(1,736)
(4,052)
250,316
(3,920)
246,396
See the Reconciliations and Disclosures section of this presentation for a full reconciliation between GAAP and Non-GAAP Financial Measures.
$
4Q'21
201,876
24,666
12,582
239,124
154,474
35,827
190,301
48,823
251,158
15,972
(2,158)
(3,683)
310,112
(2,909)
307,203
FY'20
623,658
49,455
42,920
716,033
441,245
173,338
614,583
101,450
313,490
57,231
(6,556)
(14,843)
450,772
(9,305)
441,467
$
$
FY'21
718,364
102,041
46,673
867,078
521,413
167,114
688,527
178,551
999,603
92,720
(6,775)
(14,928)
1,249,171
(9,308)
1,239,863
TPG | 10View entire presentation