Commercial Metals Company Investor Presentation Deck
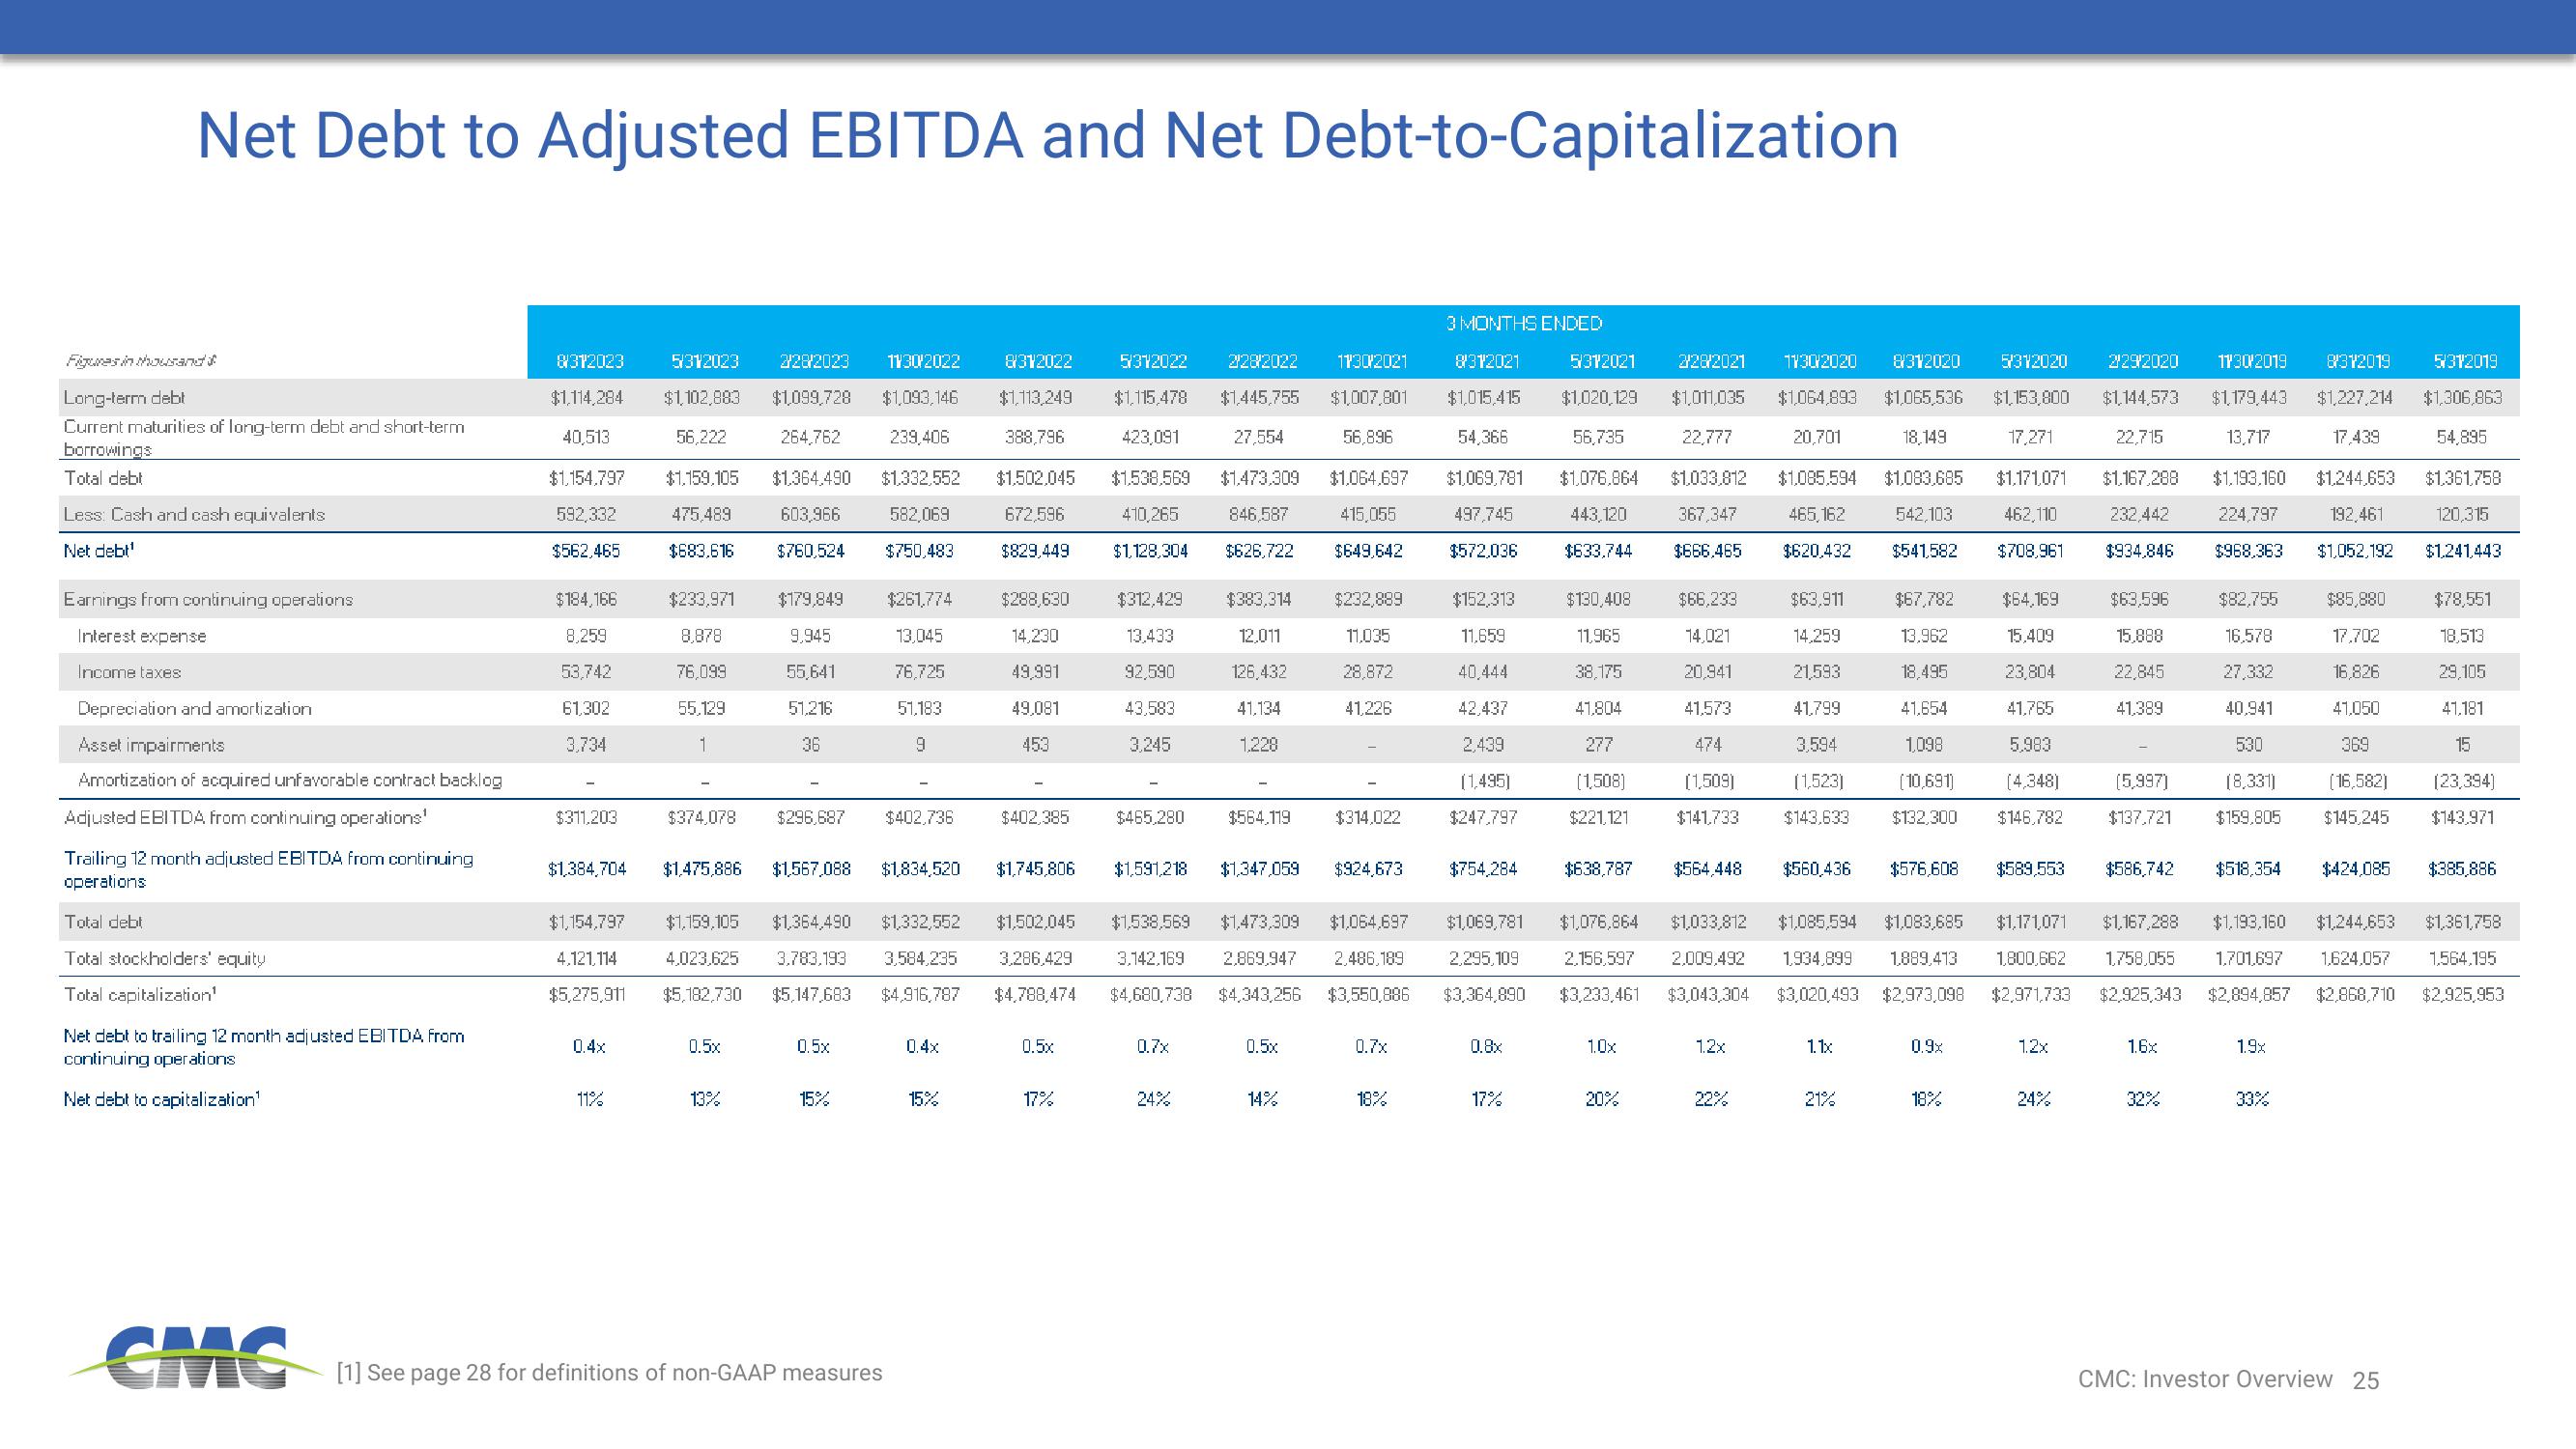
Net Debt to Adjusted EBITDA and Net Debt-to-Capitalization
Figures in thousand
Long-term debt
Current maturities of long-term debt and short-term
borrowings
Total debt
Less: Cash and cash equivalents
Net debt¹
Earnings from continuing operations
Interest expense
Income taxes
Depreciation and amortization
Asset impairments
Amortization of acquired unfavorable contract backlog
Adjusted EBITDA from continuing operations¹
Trailing 12 month adjusted EBITDA from continuing
operations
Total debt
Total stockholders' equity
Total capitalization¹
Net debt to trailing 12 month adjusted EBITDA from
continuing operations
Net debt to capitalization¹
CMC
8312023 5/312023 2/28/2023 1130/2022 8312022
$1,114,284 $1,102,883 $1,099,728 $1,093,146 $1,113,249
40,513
56,222 264,762 239,406 388,796
$1,154.797 $1,159,105 $1,364.490 $1,332,552 $1,502,045
592,332 475,489 603,966 582,069 672,596
$562,465 $683.616 $760,524 $750,483 $829,449
$184,166
8,259
53,742
61,302
3,734
$311,203
$233,971 $179,849 $261,774
8,878
9,945
13,045
76,099
55,641
76,725
51,216
51,183
36
55,129
1
9
$1,384,704 $1,475,886 $1,567,088 $1,834,520
0.4x
$374,078 $296,687 $402,736
11%
$1,154,797 $1,159,105 $1,364,490 $1,332,552 $1,502,045
4.121.114 4,023,625 3.783.193 3,584,235 3.286.429
$5,275,911 $5,182,730 $5.147.683 $4,916,787 $4,788,474
0.5x
13%
0.5x
15%
[1] See page 28 for definitions of non-GAAP measures
0.4x
$288,630
14,230
49,991
49,081
453
15%
$402,385
$1,745,806
0.5x
17%
5/312022 2/28/2022 1130/2021
$1,115,478 $1,445,755 $1,007,801
423,091
27,554
56,896
$1,538.569 $1,473,309 $1.064,697
410,265 846,587 415,055
$1,128,304 $626,722 $649,642
$312,429
13.433
92,590
43.583
3,245
$465,280
$1,591,218
$1,538,569
3,142,169
$4,680,738
0.7x
24%
$383,314
12.011
126,432
41.134
1.228
$564.119
$232,889
11.035
28,872
41,226
$1,347,059 $924,673
0.5x
$314.022
$1,473,309 $1,064,697
2,869,947 2,486,189
$4,343,256 $3,550,886
14%
0.7x
18%
3 MONTHS ENDED
8312021 5/312021
$1,015,415 $1,020,129
54,366
56,735
$1,069,781 $1,076.864
497,745 443,120
$572,036 $633,744
$152,313
11.659
40,444
42,437
2,439
(1,495)
$247,797
$754,284
0.8x
$130,408
11,965
38,175
41,804
277
(1,508)
$221,121
17%
$638,787
$1,069,781 $1,076,864 $1,033,812
2,295,109 2,156,597 2,009,492
$3,364,890 $3,233,461 $3,043,304
1.0x
228/2021 1130/2020 8312020
$1,011,035 $1,064,893 $1,065,536
22,777
20,701
18.149
$1,033,812 $1,085,594 $1,083,685
367,347 465,162 542,103
$666.465 $620,432 $541,582
20%
$66,233
14,021
20,941
41.573
474
(1,509)
$141.733
$564,448 $560,436 $576,608
12x
$63,911
14.259
21,593
41,799
3,594
(1,523)
$143.633
22%
$67,782
13.962
18.495
41,654
1.098
(10,691)
$132,300
1.1x
21%
$1,085,594 $1,083,685 $1,171,071
1,934,899 1.889,413 1,800,662
$3,020,493 $2,973,098 $2,971,733
0.9x
5/312020 2292020 1130/2019 8/312019
$1,153,800 $1,144,573 $1,179,443 $1,227,214
17,271
13,717
17.439
$1,171,071 $1,167,288 $1.193.160 $1,244,653
462,110 232,442 224,797 192,461
$708,961 $934.846 $968.363 $1,052,192
18%
$64,169
15,409
23,804
41.765
5,983
(4,348)
$146,782
$589,553
1.2x
24%
22,715
$63,596
15.888
22,845
41,389
$85,880
17.702
$82,755
16,578
27,332
16,826
40,941
41,050
530
369
(8,331) (16,582)
$159.805 $145,245
(5,997)
$137.721
$586,742 $518,354 $424,085
$1,167,288 $1,193,160 $1,244,653
1,758,055 1,701,697 1,624.057
$2,925,343 $2,894,857 $2,868,710
1.6x
32%
1.9x
CMC: Investor Overview 25
5/312019
$1,306,863
54,895
$1,361,758
120,315
$1,241,443
$78,551
18,513
29,105
41.181
15
(23,394)
$143.971
$385,886
$1,361,758
1,564,195
$2,925,953View entire presentation