Porch SPAC Presentation Deck
Operational Benchmarking
49.0%
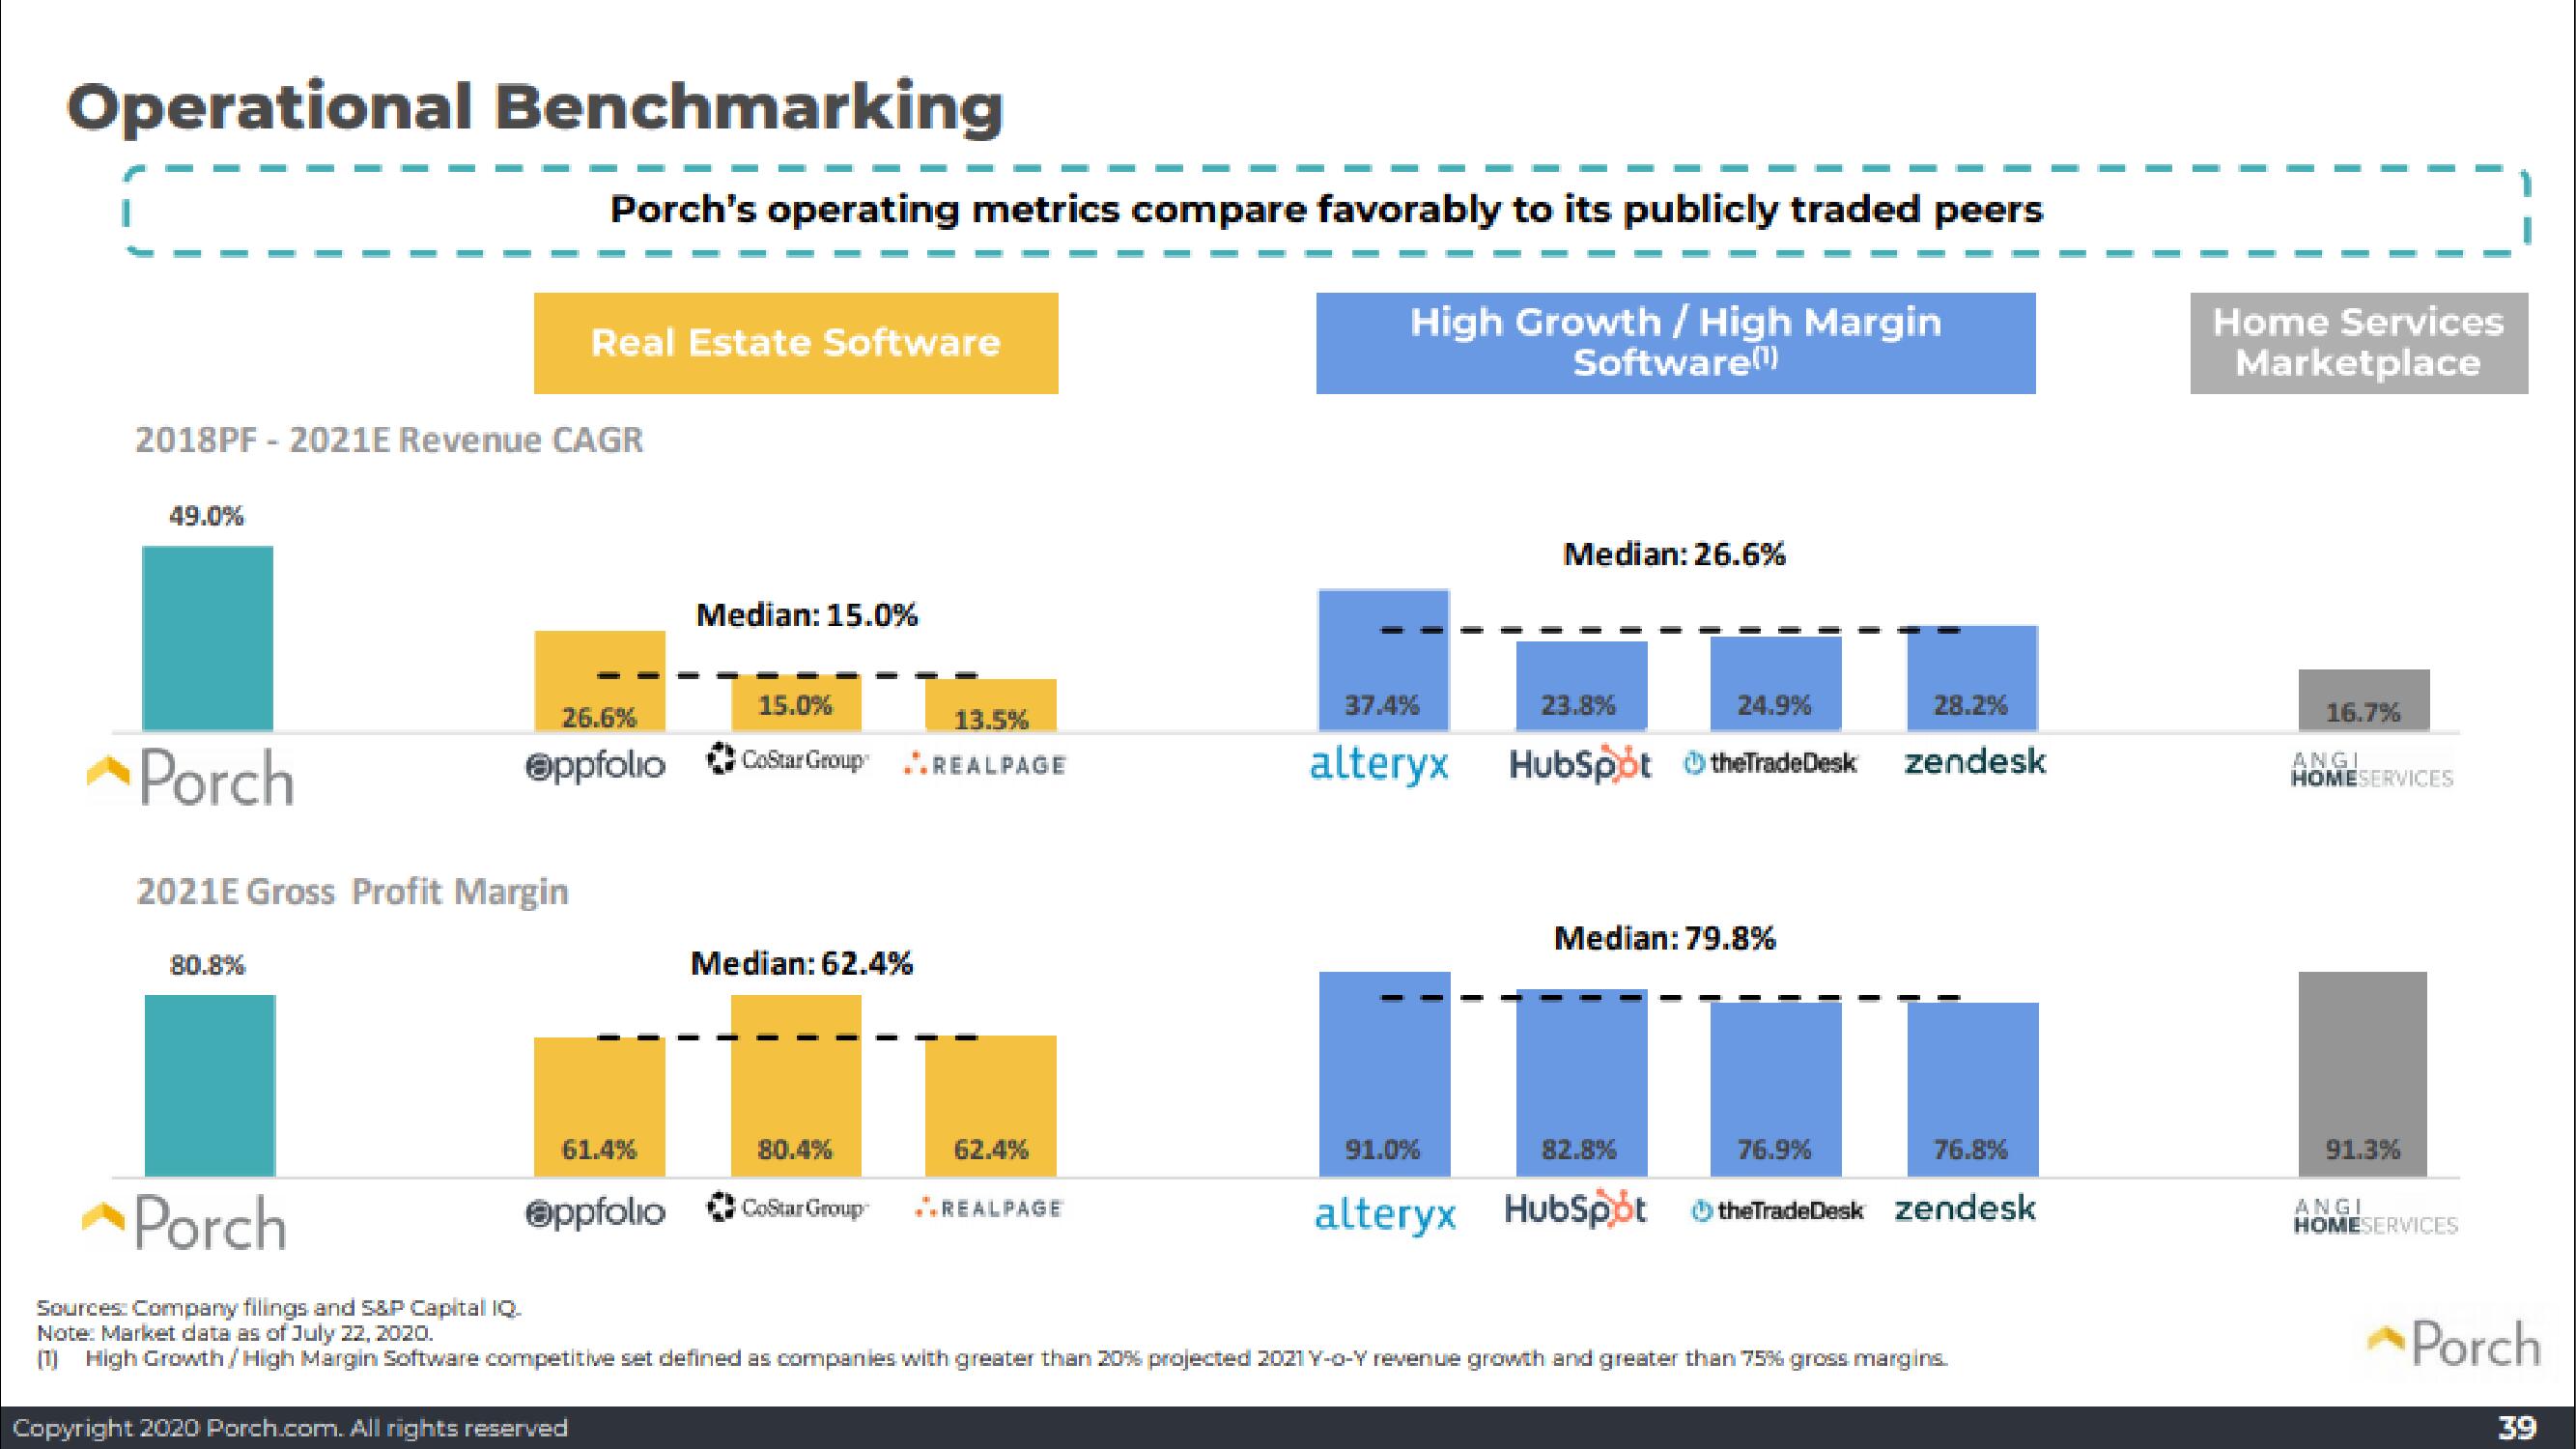
2018PF - 2021E Revenue CAGR
Porch
2021E Gross Profit Margin
80.8%
Porch
Porch's operating metrics compare favorably to its publicly traded peers
Real Estate Software
26.6%
Oppfolio
61.4%
Copyright 2020 Porch.com. All rights reserved
Median: 15.0%
15.0%
CoStar Group.REALPAGE
Median: 62.4%
80.4%
Oppfolio CoStar Group
13.5%
62.4%
REALPAGE
High Growth / High Margin
Software(¹)
Median: 26.6%
37.4%
23.8%
24.9%
alteryx HubSpot the TradeDesk
Median: 79.8%
28.2%
zendesk
91.0%
82.8%
76.9%
76.8%
alteryx HubSpot the TradeDesk zendesk
Sources: Company filings and S&P Capital IQ.
Note: Market data as of July 22, 2020.
(1) High Growth/High Margin Software competitive set defined as companies with greater than 20% projected 2021 Y-o-Y revenue growth and greater than 75% gross margins.
Home Services
Marketplace
16.7%
ANGI
HOMESERVICES
91.3%
ANGI
HOMESERVICES
Porch
39View entire presentation