Summer 2023 Solar Industry Update slide image

Summer 2023 Solar Industry Update

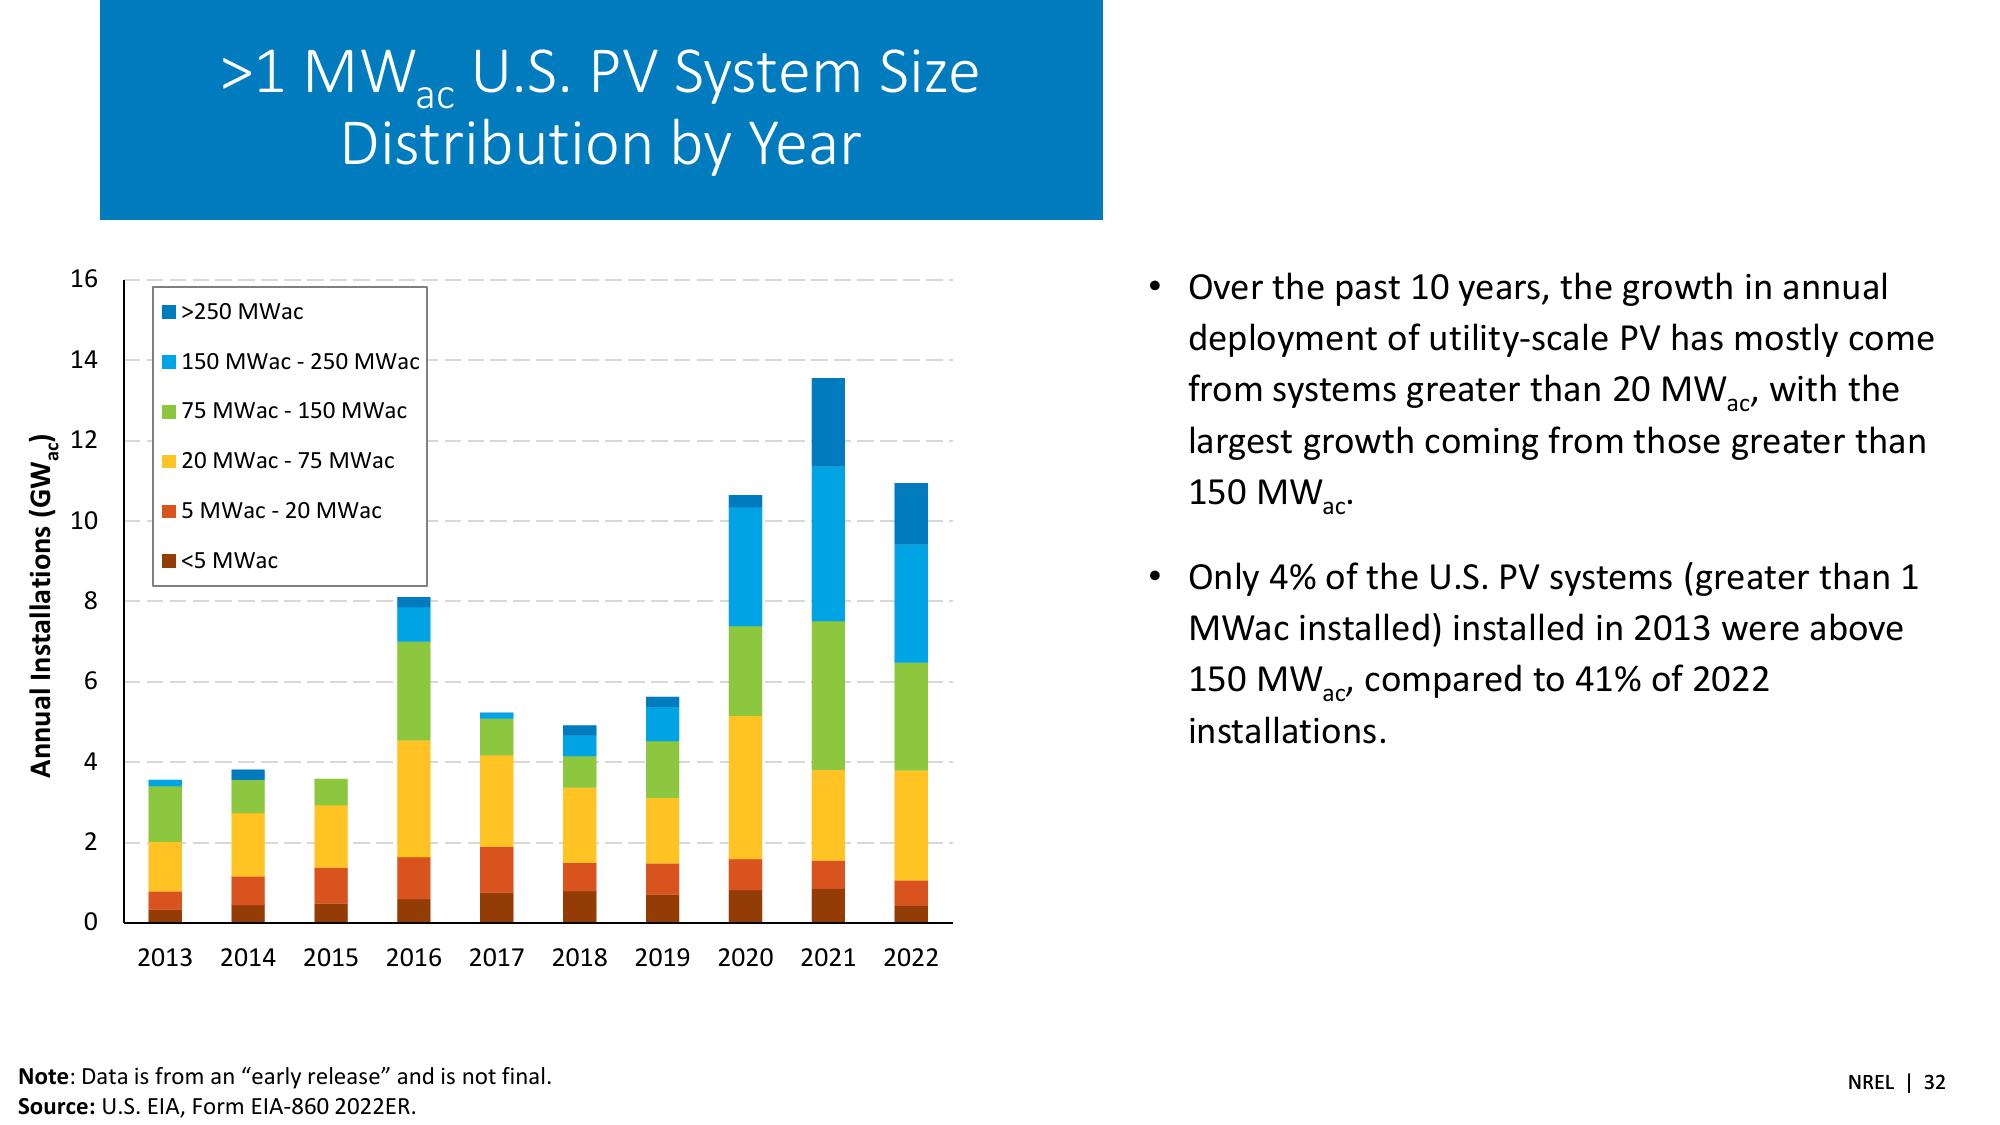
>1 MWc U.S. PV System Size ac Distribution by Year 16 >250 MWac 14 150 MWac 250 MWac 12 12 10 75 MWac 150 MWac 20 MWac - 75 MWac 5 MWac - 20 MWac <5 MWac Annual Installations (GW ac) 8 9 + 2 0 2013 2014 2015 2016 2017 2018 2019 2020 2021 2022 Note: Data is from an "early release" and is not final. Source: U.S. EIA, Form EIA-860 2022ER. ● Over the past 10 years, the growth in annual deployment of utility-scale PV has mostly come from systems greater than 20 MW, with the largest growth coming from those greater than 150 MW ac' Only 4% of the U.S. PV systems (greater than 1 MWac installed) installed in 2013 were above 150 MW compared to 41% of 2022 ac' installations. • NREL 32
View entire presentation