Ashtead Group Results Presentation Deck
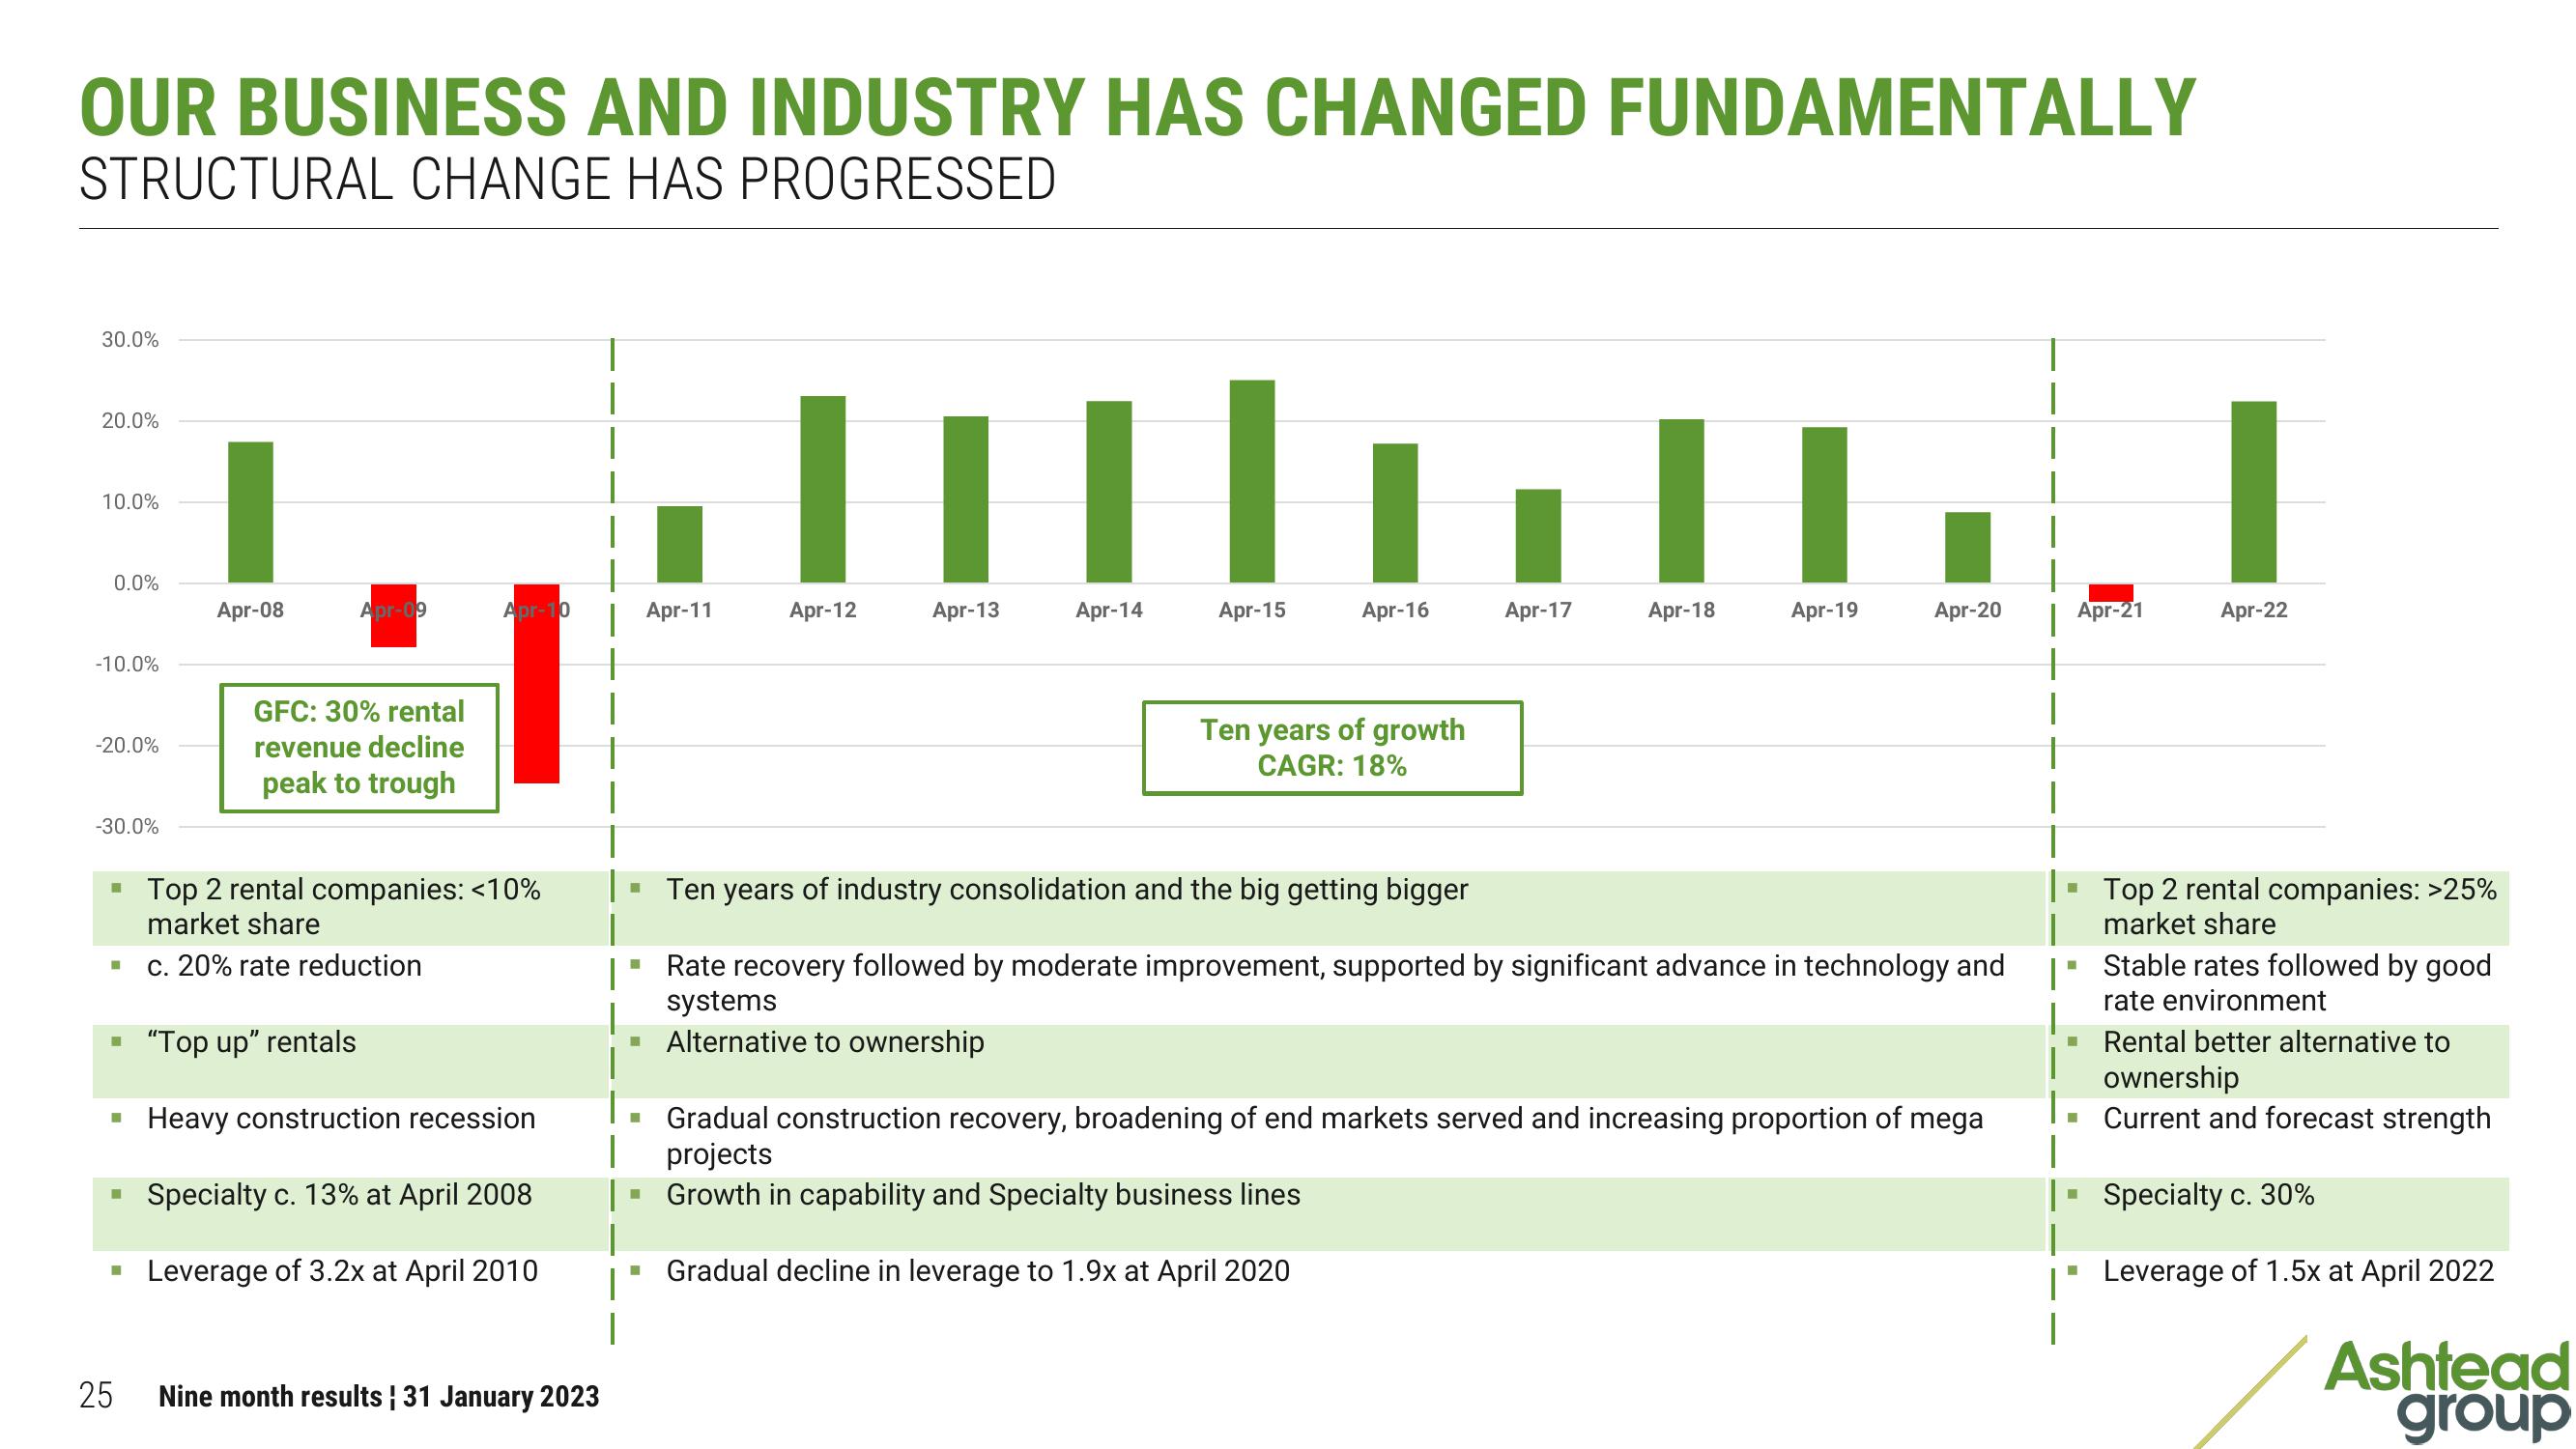
OUR BUSINESS AND INDUSTRY HAS CHANGED FUNDAMENTALLY
STRUCTURAL CHANGE HAS PROGRESSED
30.0%
20.0%
10.0%
0.0%
-10.0%
-20.0%
-30.0%
■
■
■
■
■
25
Apr-08
Apr-09
GFC: 30% rental
revenue decline
peak to trough
Apr-10
Top 2 rental companies: <10%
market share
c. 20% rate reduction
"Top up" rentals
Heavy construction recession
Specialty c. 13% at April 2008
Leverage of 3.2x at April 2010
1
1
Nine month results | 31 January 2023
H
H
■
■
Apr-11
■
THI
Apr-14
Apr-12
Apr-13
Apr-15
Apr-16
Ten years of growth
CAGR: 18%
■ Ten years of industry consolidation and the big getting bigger
Rate recovery followed by moderate improvement, supported by significant advance in technology and
systems
Alternative to ownership
Apr-17
Apr-18
Apr-19
Apr-20
Gradual construction recovery, broadening of end markets served and increasing proportion of mega
projects
Growth in capability and Specialty business lines
Gradual decline in leverage to 1.9x at April 2020
Apr-21
I
T
▪ Top 2 rental companies: >25%
market share
Apr-22
Stable rates followed by good
rate environment
■ Rental better alternative
ownership
Current and forecast strength
Specialty c. 30%
Leverage of 1.5x at April 2022
■
Ashtead
groupView entire presentation