Investor Presentation
2-STRATEGY AND OPERATIONAL TARGETS - STORAGE CAPEX
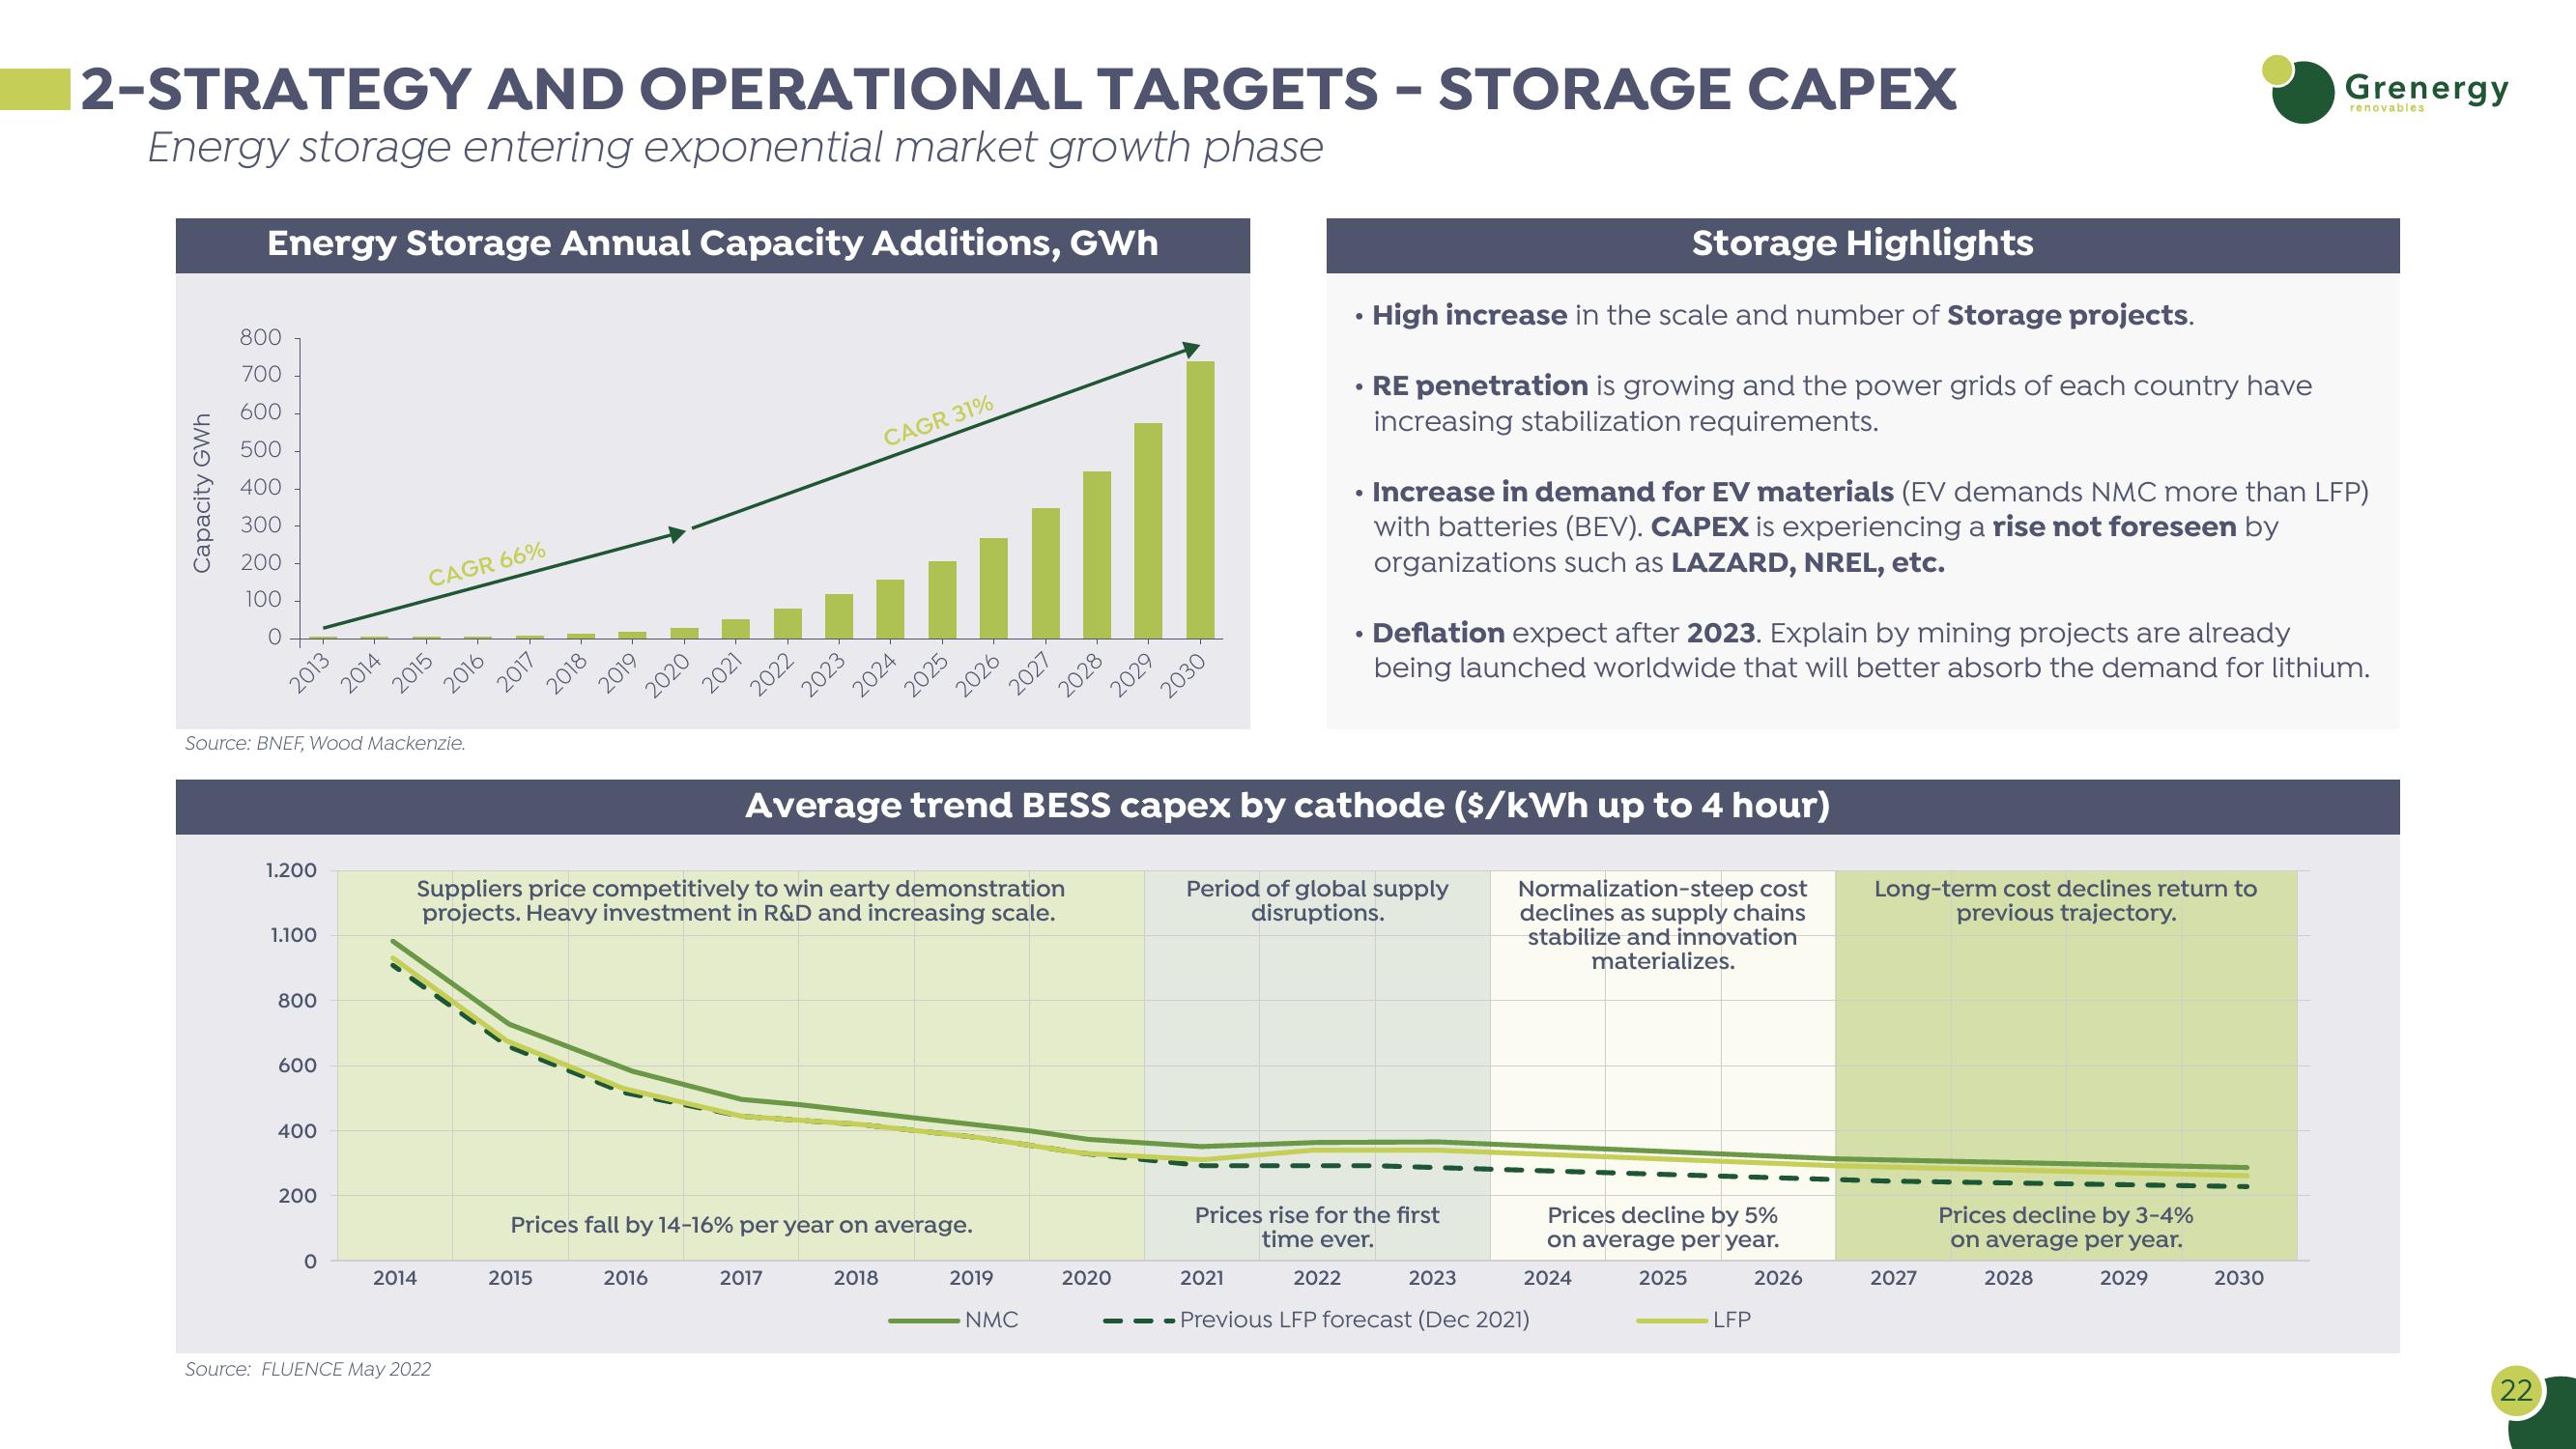
Energy storage entering exponential market growth phase
Energy Storage Annual Capacity Additions, GWh
800
700
Capacity GWh
600
500
400
300
200
100
O
Source: BNEF, Wood Mackenzie.
2013
CAGR 66%
2014
2015
2016
2017
2018
2019
2020
2021
2022
2023
2024
CAGR 31%
2025
2026
2027
2028
2029
2030
Grenergy
renovables
•
.
•
•
Storage Highlights
High increase in the scale and number of Storage projects.
RE penetration is growing and the power grids of each country have
increasing stabilization requirements.
Increase in demand for EV materials (EV demands NMC more than LFP)
with batteries (BEV). CAPEX is experiencing a rise not foreseen by
organizations such as LAZARD, NREL, etc.
Deflation expect after 2023. Explain by mining projects are already
being launched worldwide that will better absorb the demand for lithium.
Average trend BESS capex by cathode ($/kWh up to 4 hour)
1.200
Suppliers price competitively to win earty demonstration
projects. Heavy investment in R&D and increasing scale.
Period of global supply
disruptions.
1.100
Normalization-steep cost
declines as supply chains
stabilize and innovation
materializes.
Long-term cost declines return to
previous trajectory.
800
600
400
200
Prices fall by 14-16% per year on average.
0
2014
2015
2016
Source: FLUENCE May 2022
2017
2018
2019
2020
2021
NMC
Prices rise for the first
time ever.
2022
2023
Prices decline by 5%
on average per year.
2024
2025
2026
2027
-Previous LFP forecast (Dec 2021)
LFP
Prices decline by 3-4%
on average per year.
2028
2029
2030
22View entire presentation