LVMH Results Presentation Deck
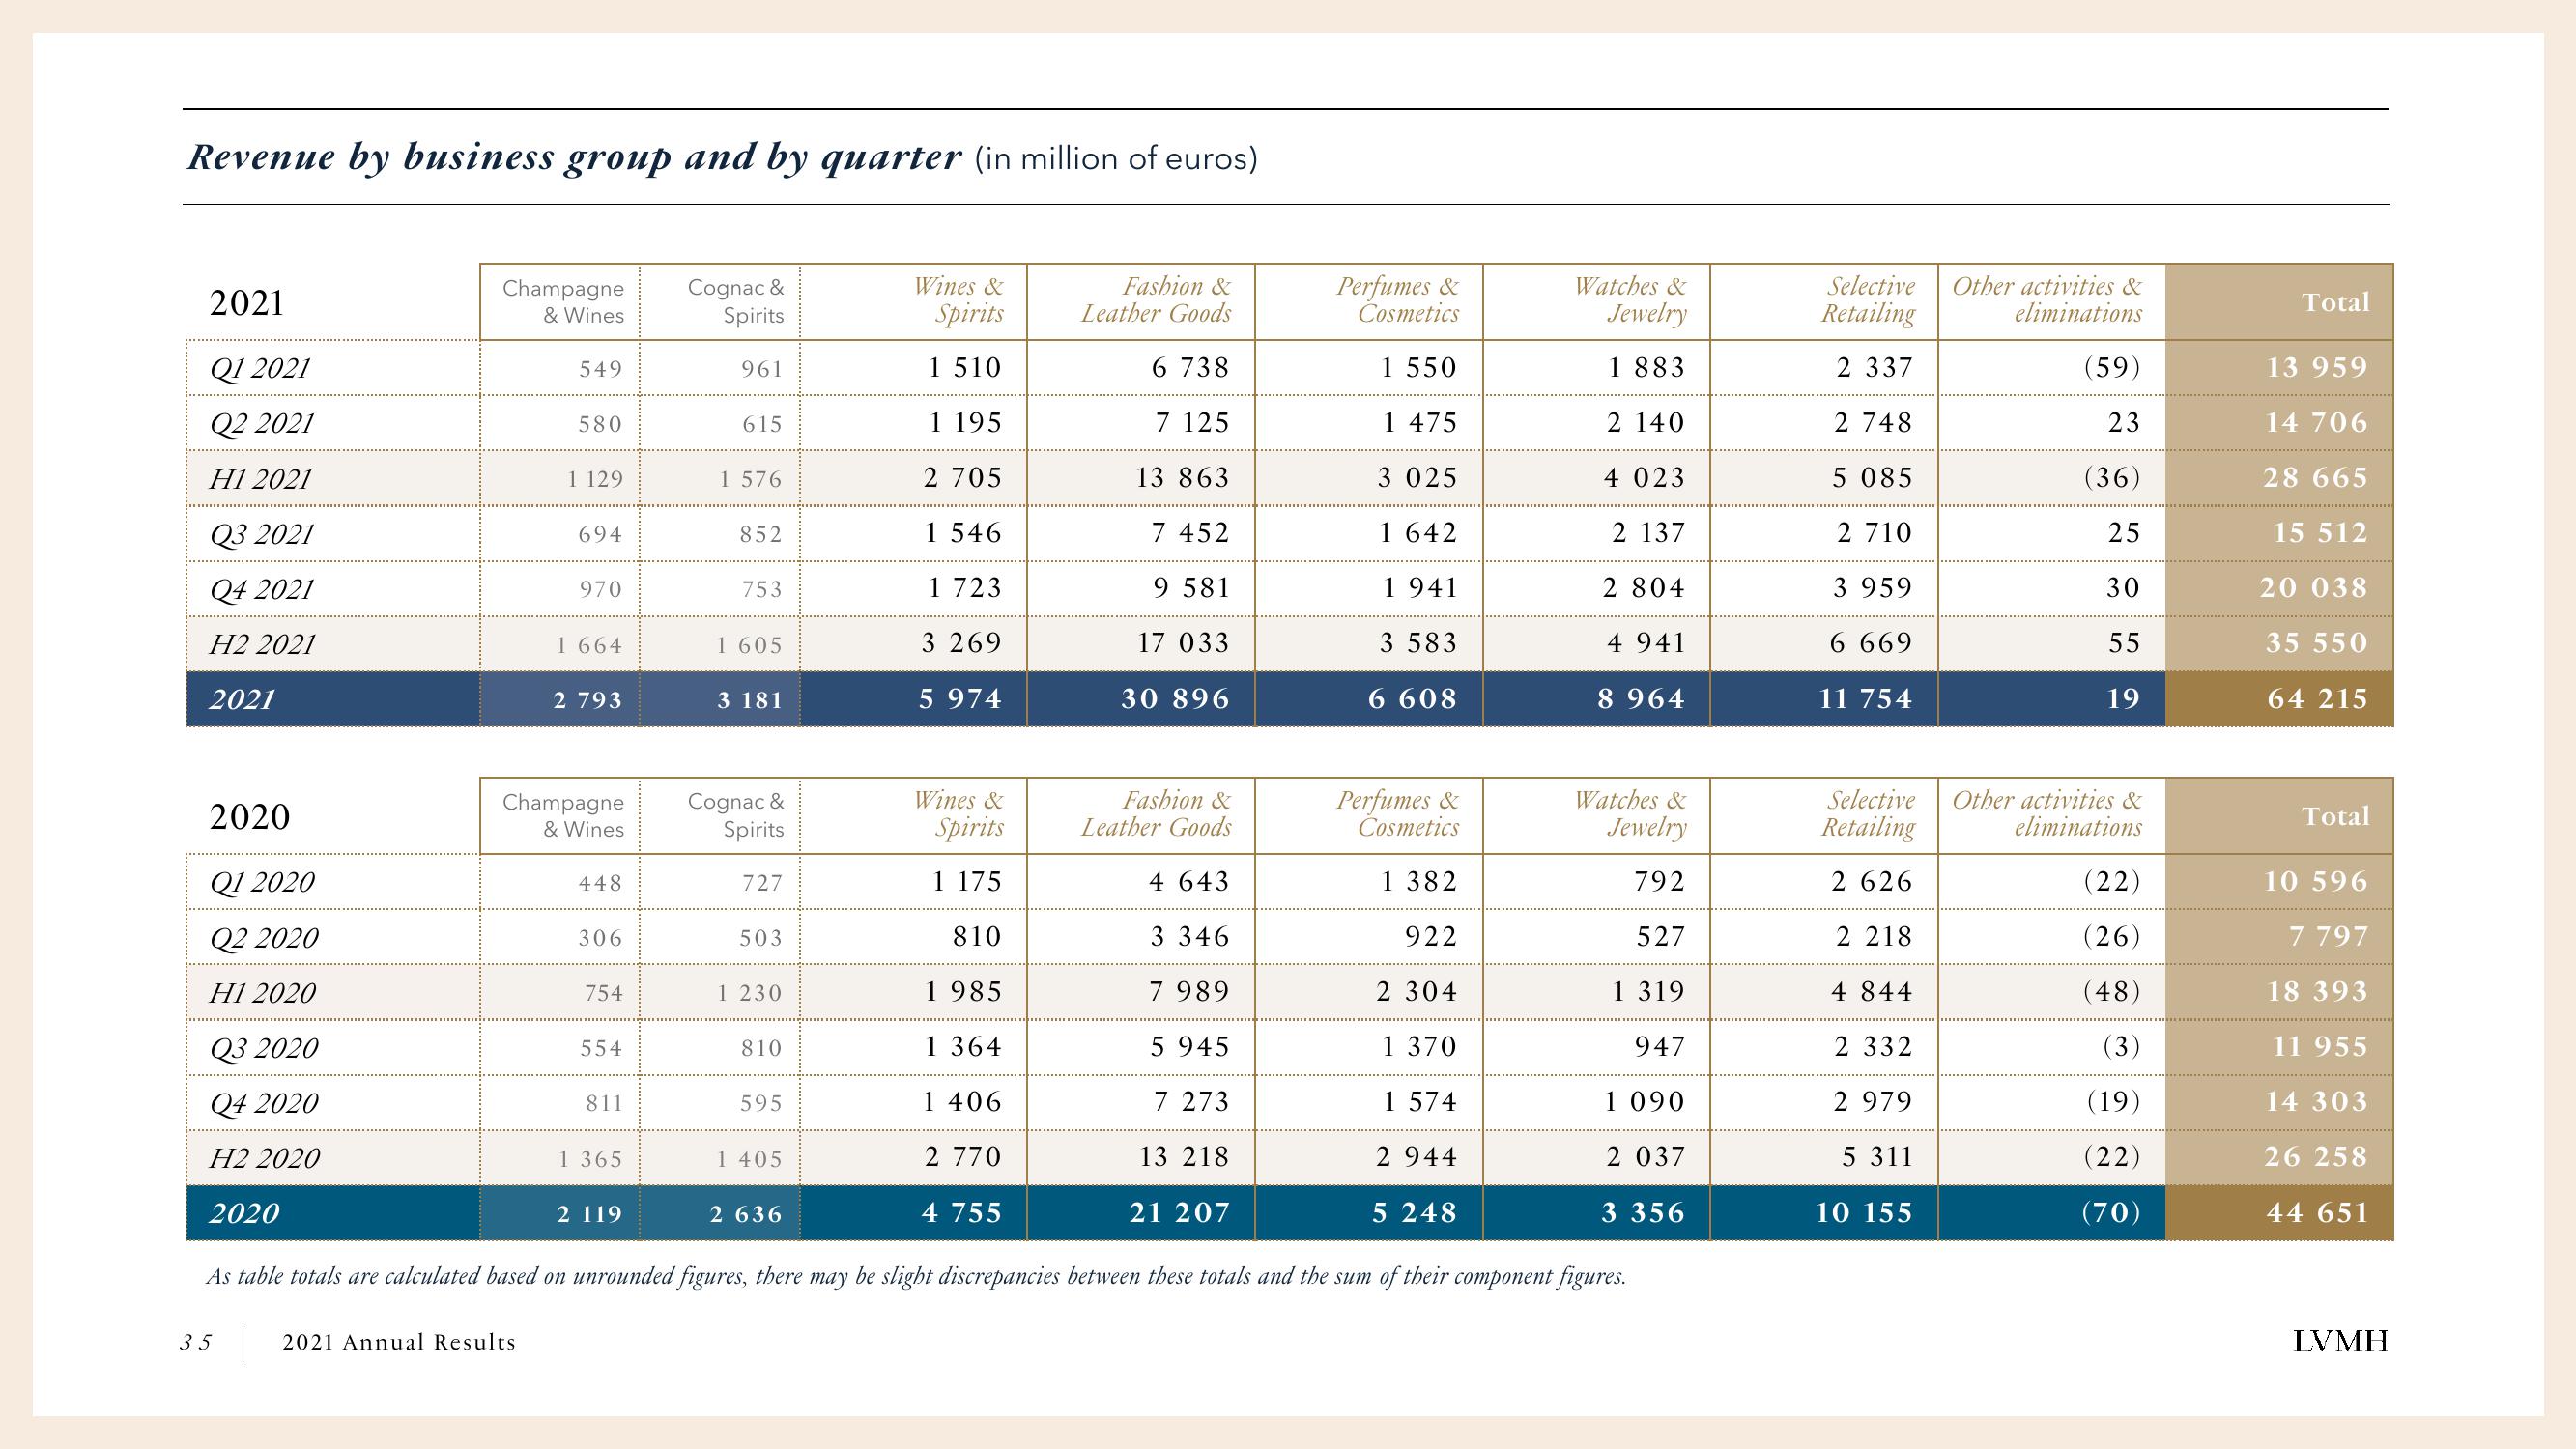
Revenue by business group and by quarter (in million of euros)
2021
Q1 2021
Q2 2021
H1 2021
Q3 2021
Q4 2021
H2 2021
2021
2020
Q1 2020
Q2 2020
H1 2020
Q3 2020
Q4 2020
H2 2020
Champagne
& Wines
2020
549
580
1 129
694
970
1 664
2 793
Champagne
& Wines
448
306
754
554
811
1 365
Cognac &
Spirits
961
2 119
615
1 576
Watches &
Perfumes &
Cosmetics
Jewelry
1 382
792
922
527
2 304
1 319
1 370
947
1 574
1 090
2 944
2 037
5 248
3 356
As table totals are calculated based on unrounded figures, there may be slight discrepancies between these totals and the sum of their component figures.
35 2021 Annual Results
852
753
1 605
3 181
Cognac &
Spirits
727
503
1 230
810
595
1 405
Wines &
Spirits
1 510
1 195
2 705
1 546
1 723
3 269
5 974
2 636
Fashion &
Leather Goods
6 738
7 125
13 863
7 452
9 581
17 033
30 896
Wines &
Spirits
1 175
810
1 985
1 364
1 406
2 770
4 755
Perfumes &
Cosmetics
1 550
1 475
3 025
1 642
1941
Fashion &
Leather Goods
4 643
3 346
7 989
5 945
7 273
13 218
21 207
3 583
6 608
Watches &
Jewelry
1 883
2 140
4 023
2 137
2 804
4 941
8 964
Selective
Retailing
2 337
2 748
5 085
2 710
3 959
6 669
11 754
Selective
Retailing
2 626
2 218
4 844
2 332
2 979
5 311
10 155
Other activities &
eliminations
(59)
23
(36)
25
30
55
19
Other activities &
eliminations
(22)
(26)
(48)
(3)
(19)
(22)
(70)
Total
13 959
14 706
28 665
15 512
20 038
35 550
64 215
Total
10 596
7 797
18 393
11 955
14 303
26 258
44 651
LVMHView entire presentation