Nexters Results Presentation Deck
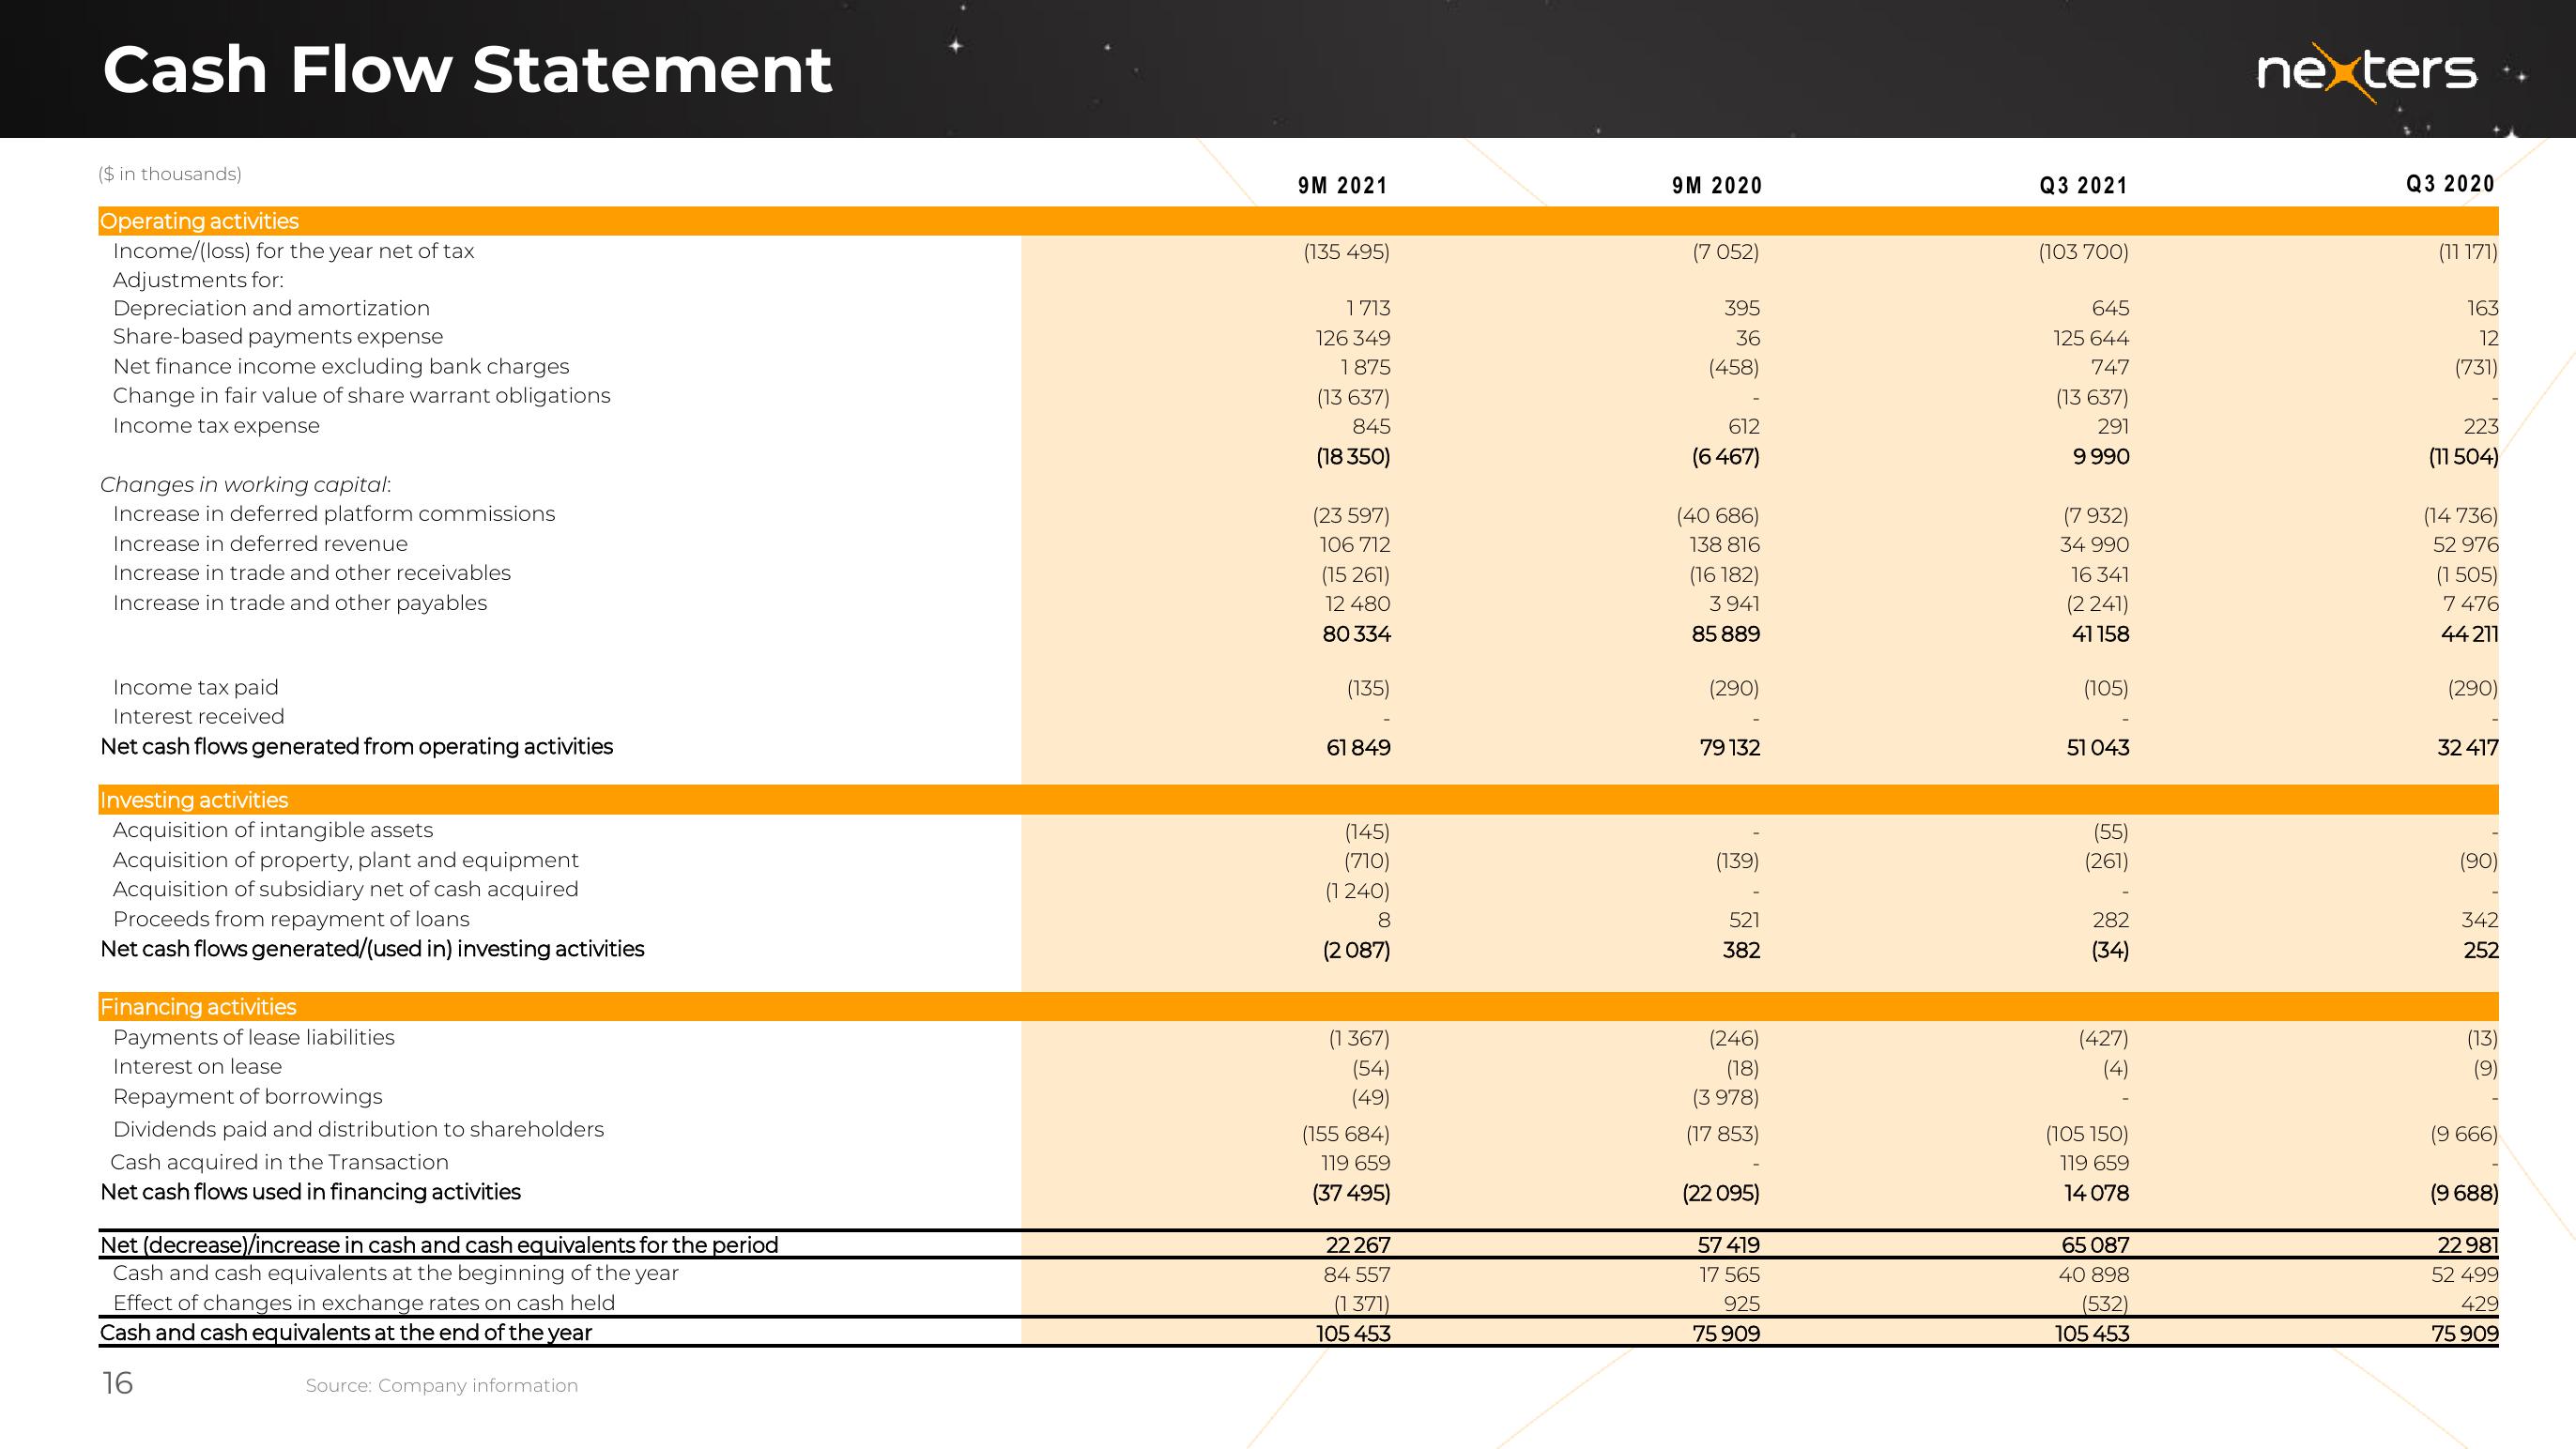
Cash Flow Statement
($ in thousands)
Operating activities
Income/(loss) for the year net of tax
Adjustments for:
Depreciation and amortization
Share-based payments expense
Net finance income excluding bank charges
Change in fair value of share warrant obligations
Income tax expense
Changes in working capital:
Increase in deferred platform commissions
Increase in deferred revenue
Increase in trade and other receivables
Increase in trade and other payables
Income tax paid
Interest received
Net cash flows generated from operating activities
Investing activities
Acquisition of intangible assets
Acquisition of property, plant and equipment
Acquisition of subsidiary net of cash acquired
Proceeds from repayment of loans
Net cash flows generated/(used in) investing activities
Financing activities
Payments of lease liabilities
Interest on lease
Repayment of borrowings
Dividends paid and distribution to shareholders
Cash acquired in the Transaction
Net cash flows used in financing activities
Net (decrease)/increase in cash and cash equivalents for the period
Cash and cash equivalents at the beginning of the year
Effect of changes in exchange rates on cash held
Cash and cash equivalents at the end of the year
16
Source: Company information
9M 2021
(135 495)
1713
126 349
1875
(13 637)
845
(18350)
(23 597)
106 712
(15 261)
12 480
80 334
(135)
61 849
(145)
(710)
(1 240)
8
(2087)
(1367)
(54)
(49)
(155 684)
119 659
(37 495)
22 267
84 557
(1371)
105 453
9M 2020
(7 052)
395
36
(458)
612
(6 467)
(40 686)
138 816
(16 182)
3941
85 889
(290)
79 132
(139)
521
382
(246)
(18)
(3978)
(17 853)
(22 095)
57 419
17 565
925
75 909
Q3 2021
(103 700)
645
125 644
747
(13 637)
291
9 990
(7 932)
34 990
16 341
(2 241)
41158
(105)
51 043
(55)
(261)
282
(34)
(427)
(4)
(105 150)
119 659
14078
65 087
40 898
(532)
105 453
nexters
Q3 2020
(11 171)
163
12
(731)
223
(11 504)
(14 736)
52 976
(1 505)
7 476
44 211
(290)
32 417
(90)
342
252
(13)
@
(9 666)
(9 688)
22 981
52 499
429
75 909View entire presentation