Nerdy Investor Presentation Deck
Net LTV
2
Net LTV
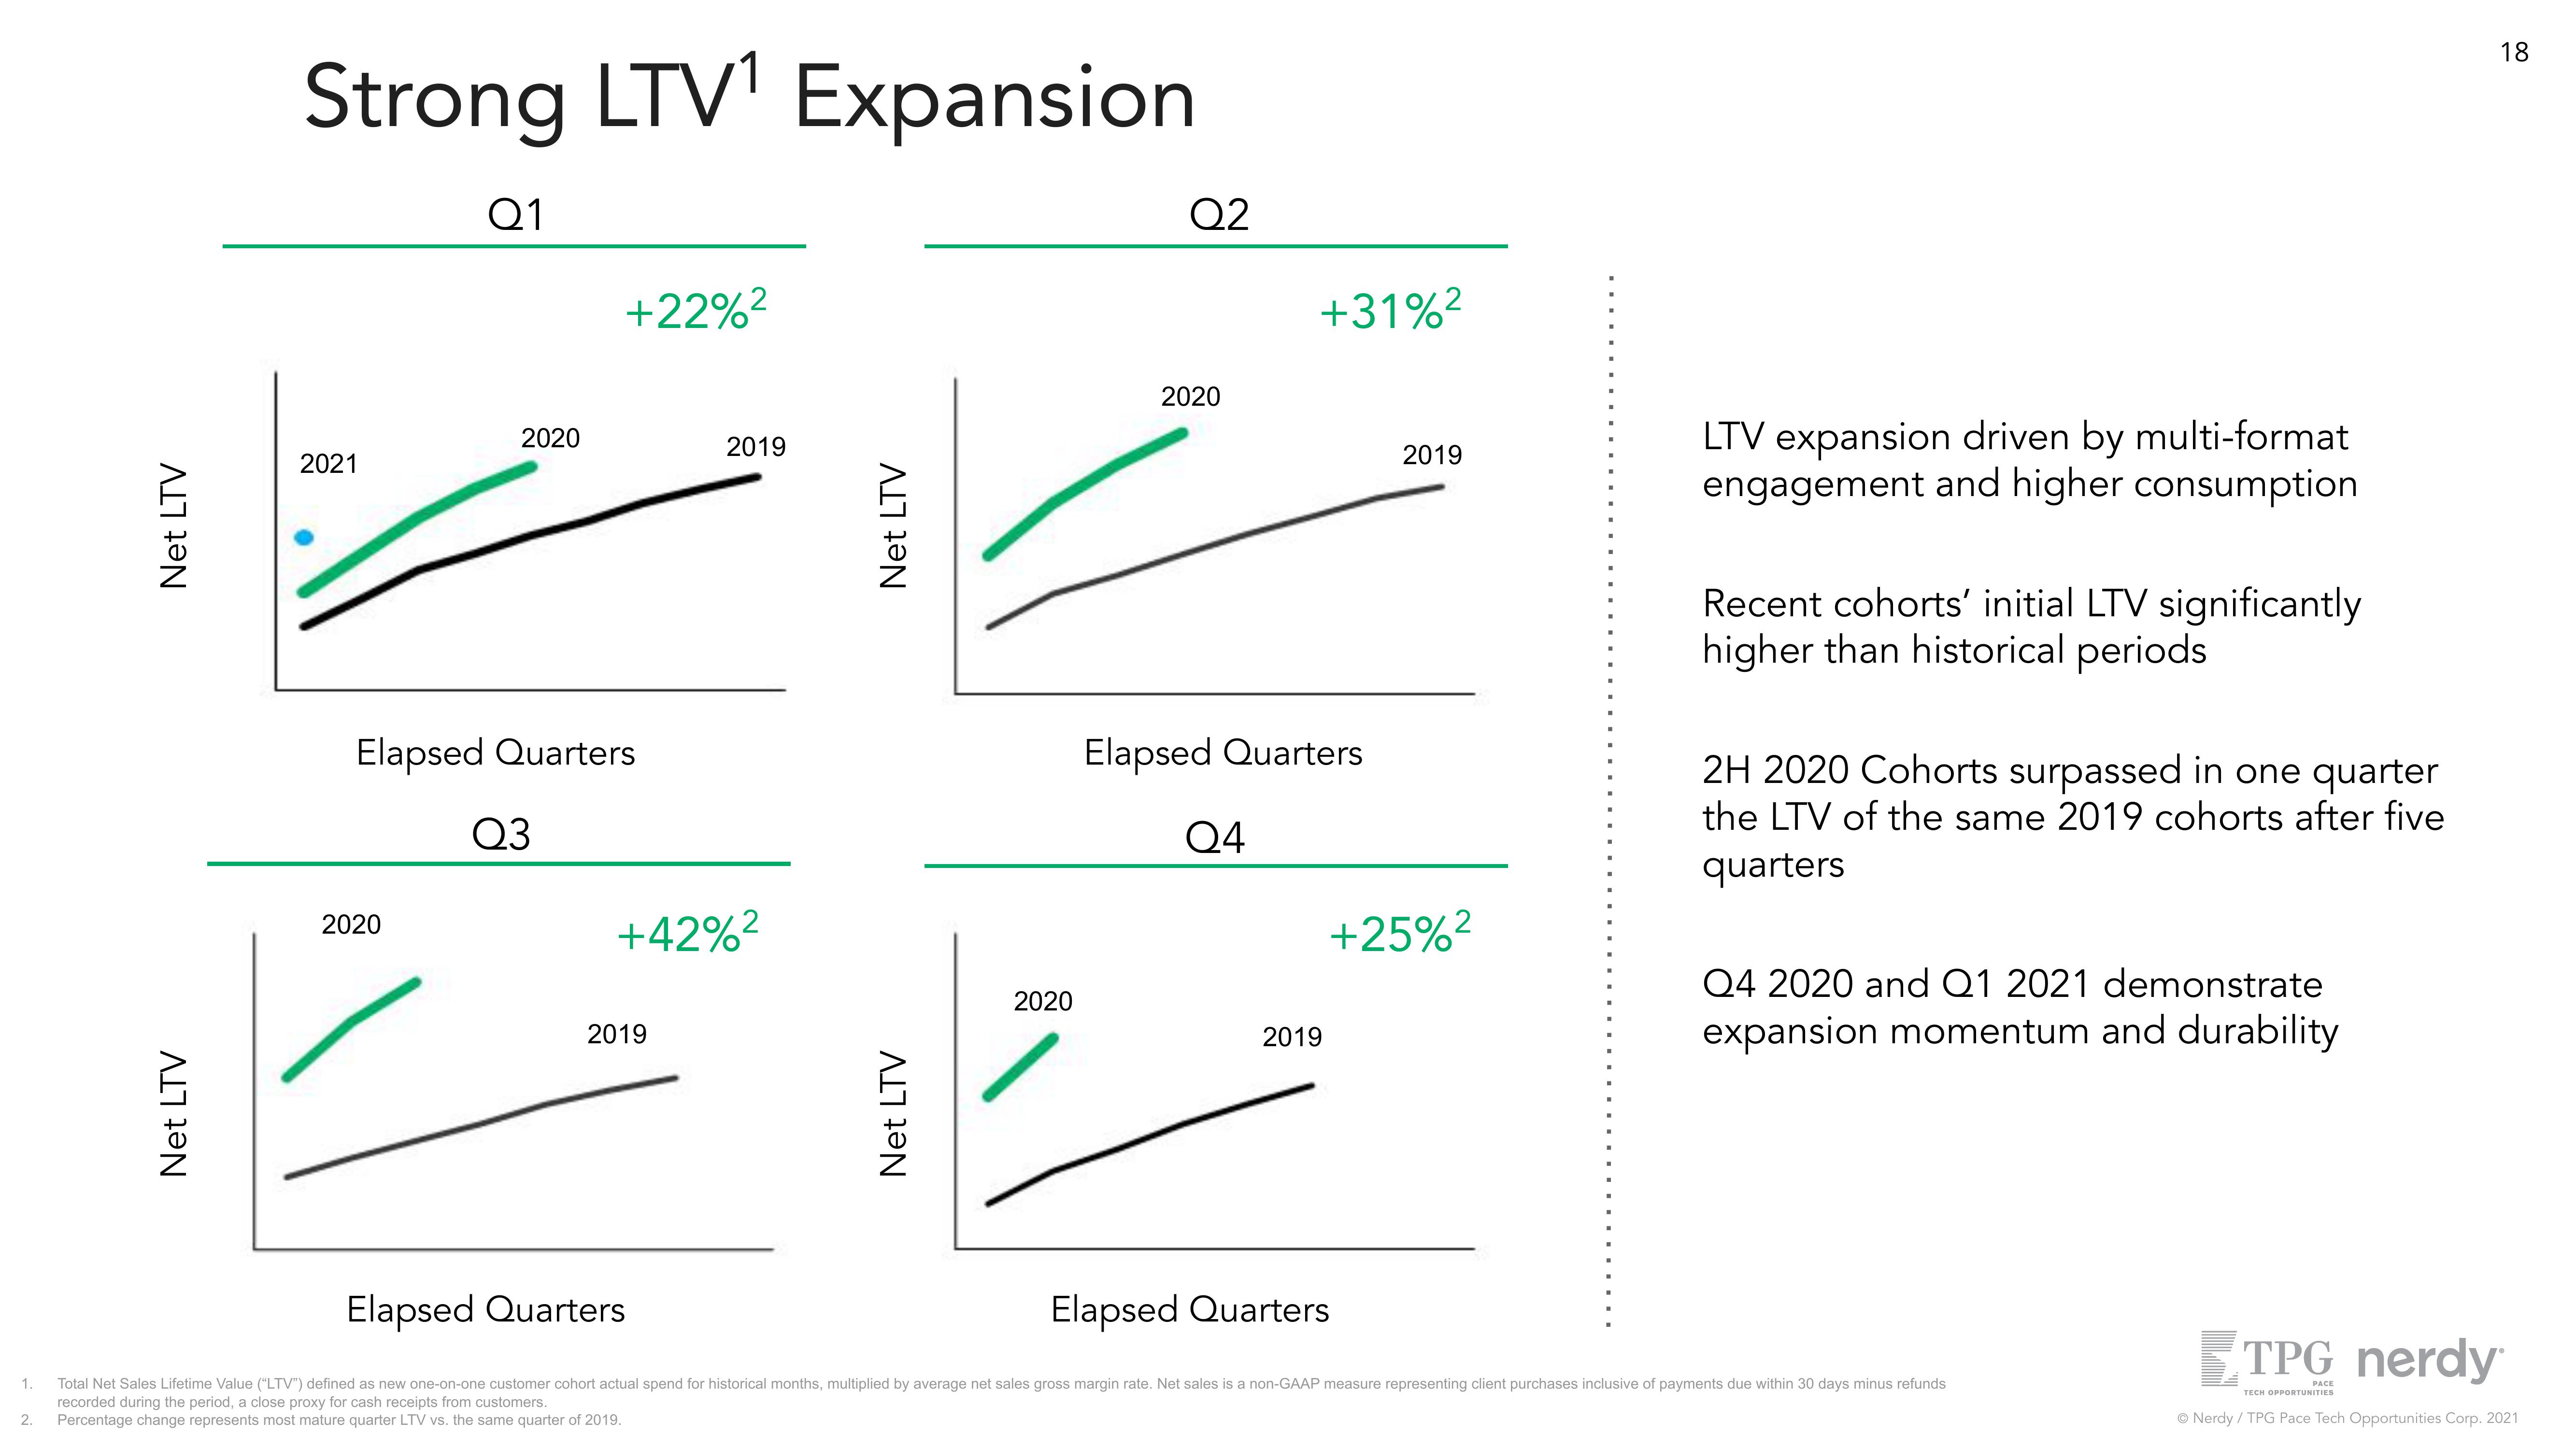
Strong LTV¹ Expansion.
2021
Q1
2020
2020
Elapsed Quarters
+22%²
Q3
2019
+42%²
2019
Net LTV
Net LTV
2020
Q2
2020
+31%²
Elapsed Quarters
Q4
2019
2019
+25%²
LTV expansion driven by multi-format
engagement and higher consumption
Recent cohorts' initial LTV significantly
higher than historical periods
2H 2020 Cohorts surpassed in one quarter
the LTV of the same 2019 cohorts after five
quarters
Q4 2020 and Q1 2021 demonstrate
expansion momentum and durability
Elapsed Quarters
Elapsed Quarters
1. Total Net Sales Lifetime Value ("LTV") defined as new one-on-one customer cohort actual spend for historical months, multiplied by average net sales gross margin rate. Net sales is a non-GAAP measure representing client purchases inclusive of payments due within 30 days minus refunds
recorded during the period, a close proxy for cash receipts from customers.
Percentage change represents most mature quarter LTV vs. the same quarter of 2019.
18
TPG nerdy
PACE
TECH
OPPORTUNITIES
Ⓒ Nerdy / TPG Pace Tech Opportunities Corp. 2021View entire presentation