Dutch Bros Results Presentation Deck
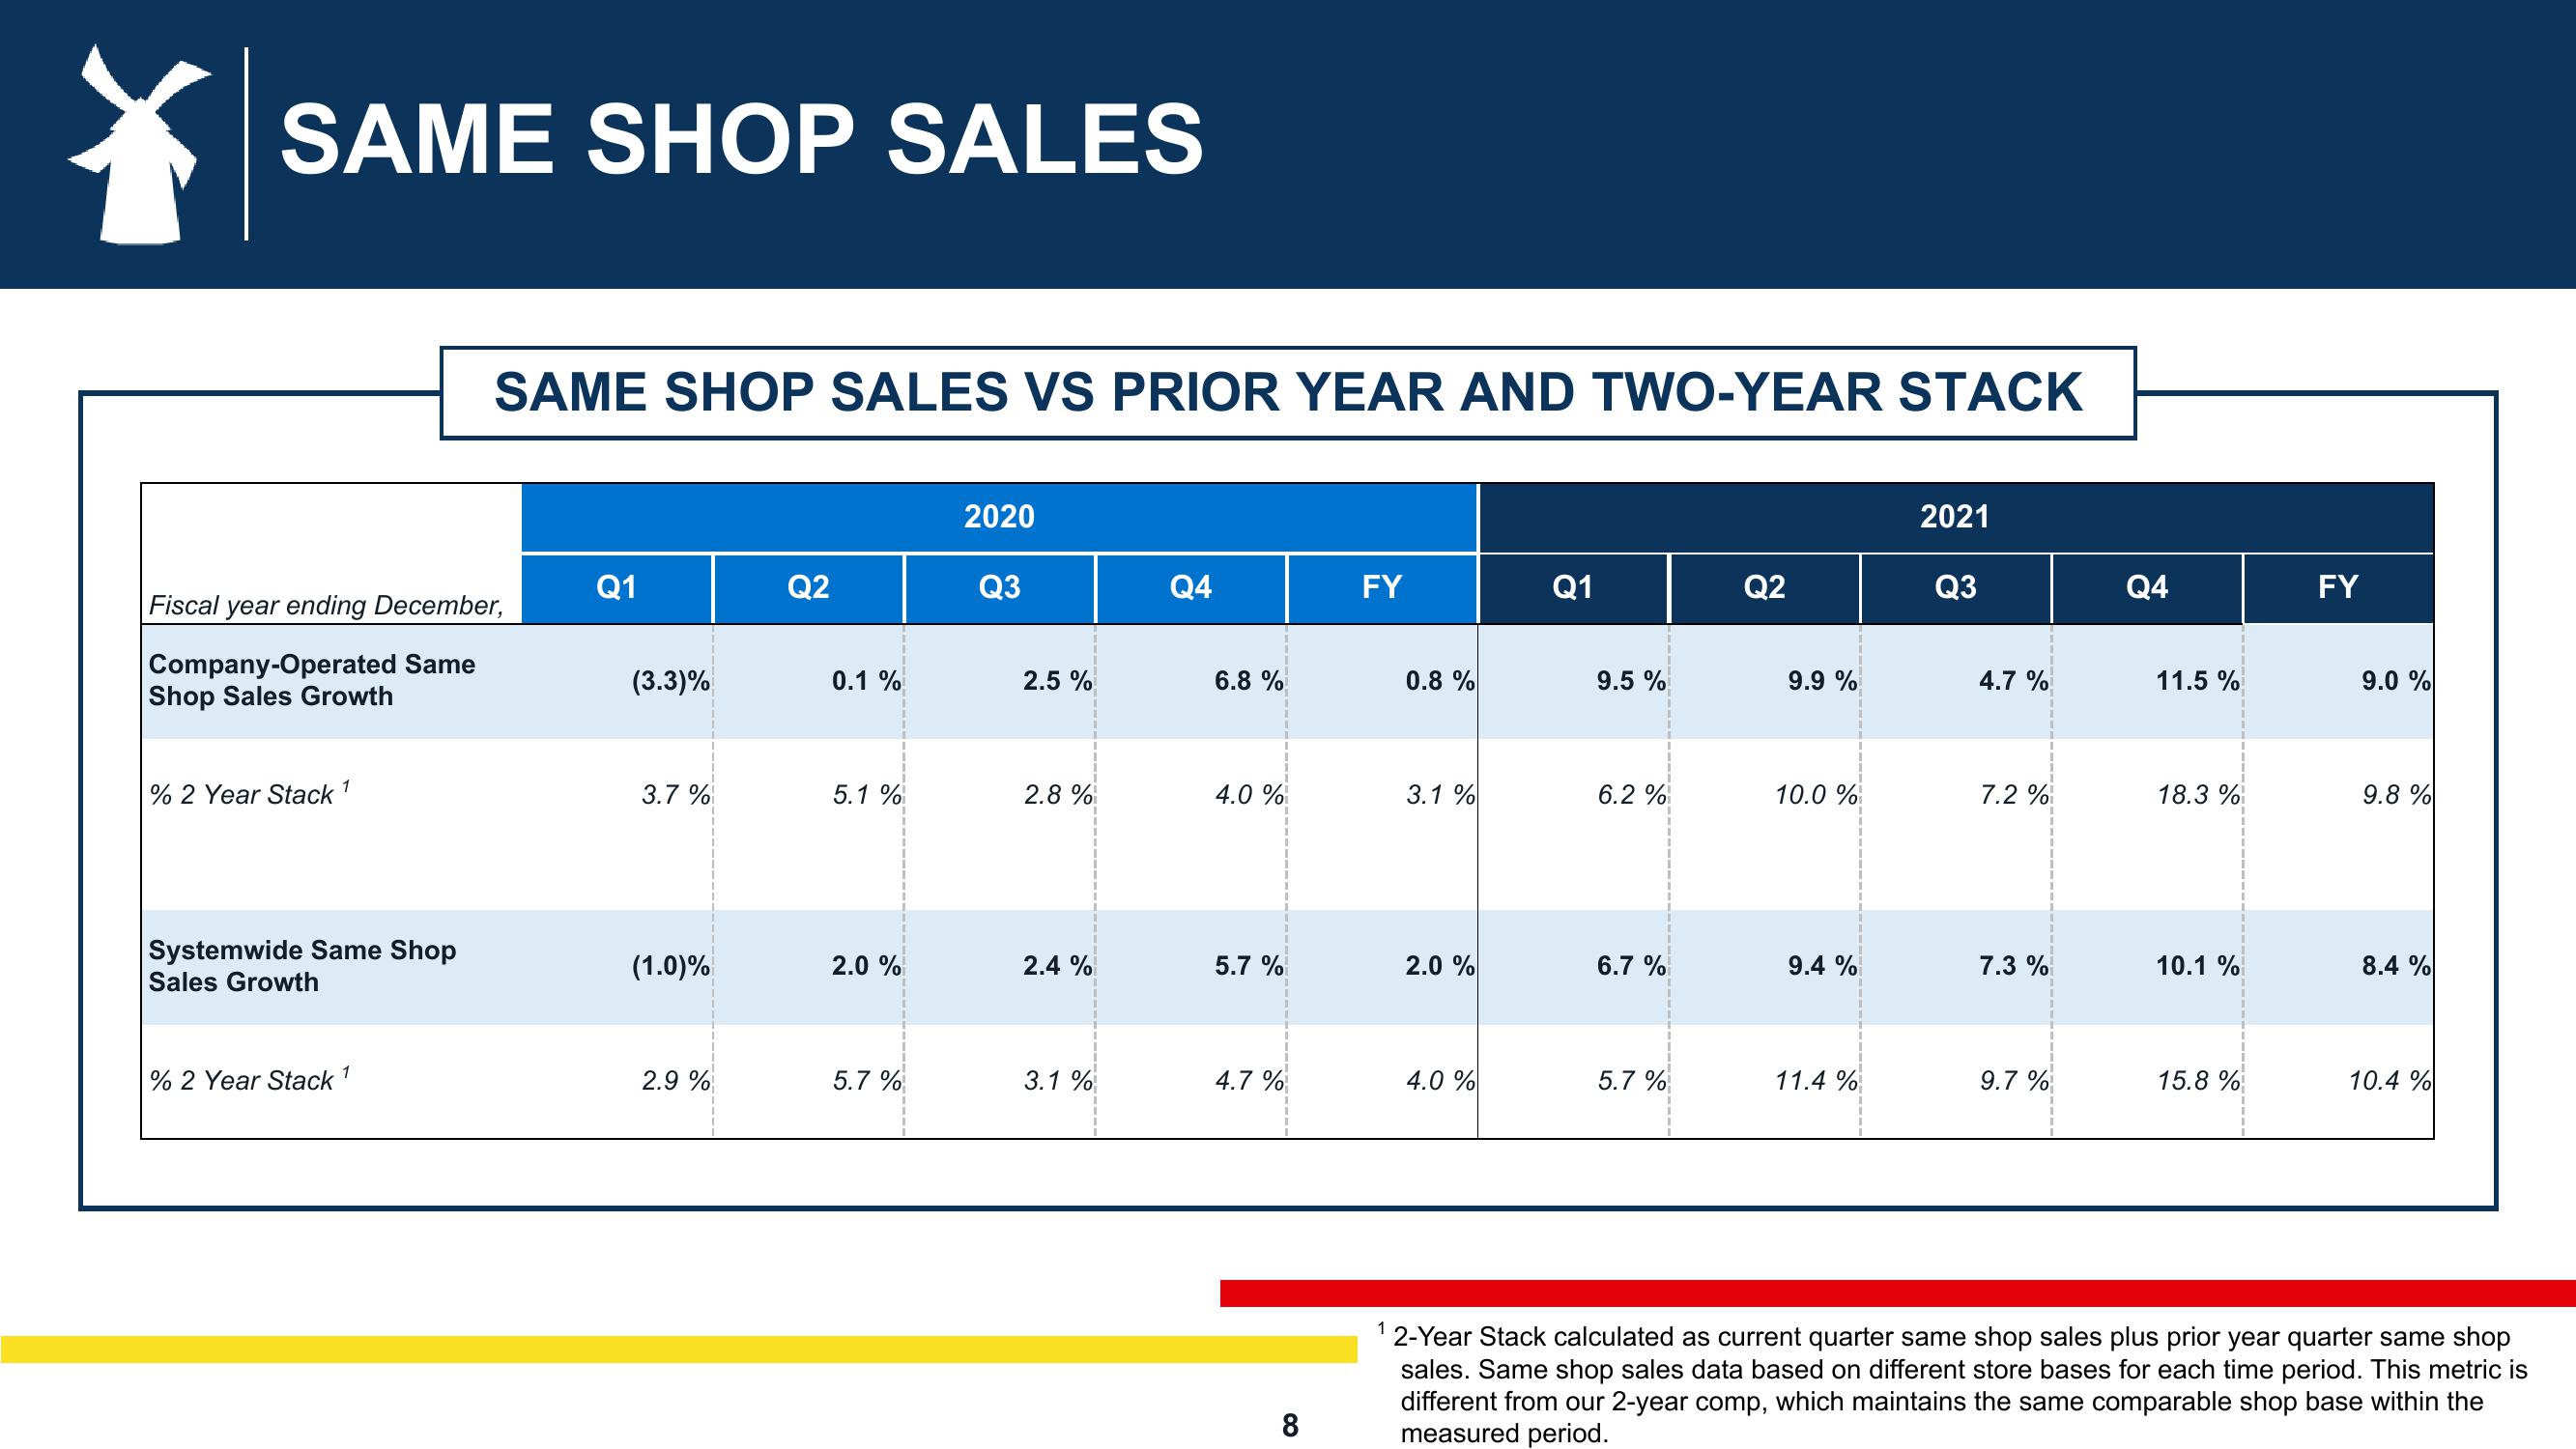
SAME SHOP SALES
Fiscal year ending December,
Company-Operated Same
Shop Sales Growth
% 2 Year Stack ¹
Systemwide Same Shop
Sales Growth
% 2 Year Stack
SAME SHOP SALES VS PRIOR YEAR AND TWO-YEAR STACK
1
Q1
(3.3)%
3.7 %
(1.0)%
2.9 %
Q2
0.1%
5.1 %
2.0 %
5.7 %
2020
Q3
2.5 %
2.8%
2.4%
3.1 %
Q4
6.8 %
4.0 %
5.7 %
4.7 %
8
FY
1
0.8 %
3.1 %
2.0 %
4.0 %
Q1
9.5 %
6.2 %
6.7 %
5.7 %
Q2
9.9 %
10.0 %
9.4 %
11.4 %
2021
Q3
4.7 %
7.2 %
7.3%
9.7 %
Q4
11.5 %
18.3 %
10.1 %
15.8 %
FY
9.0 %
9.8%
8.4 %
10.4 %
2-Year Stack calculated as current quarter same shop sales plus prior year quarter same shop
sales. Same shop sales data based on different store bases for each time period. This metric is
different from our 2-year comp, which maintains the same comparable shop base within the
measured period.View entire presentation