Volta SPAC Presentation Deck
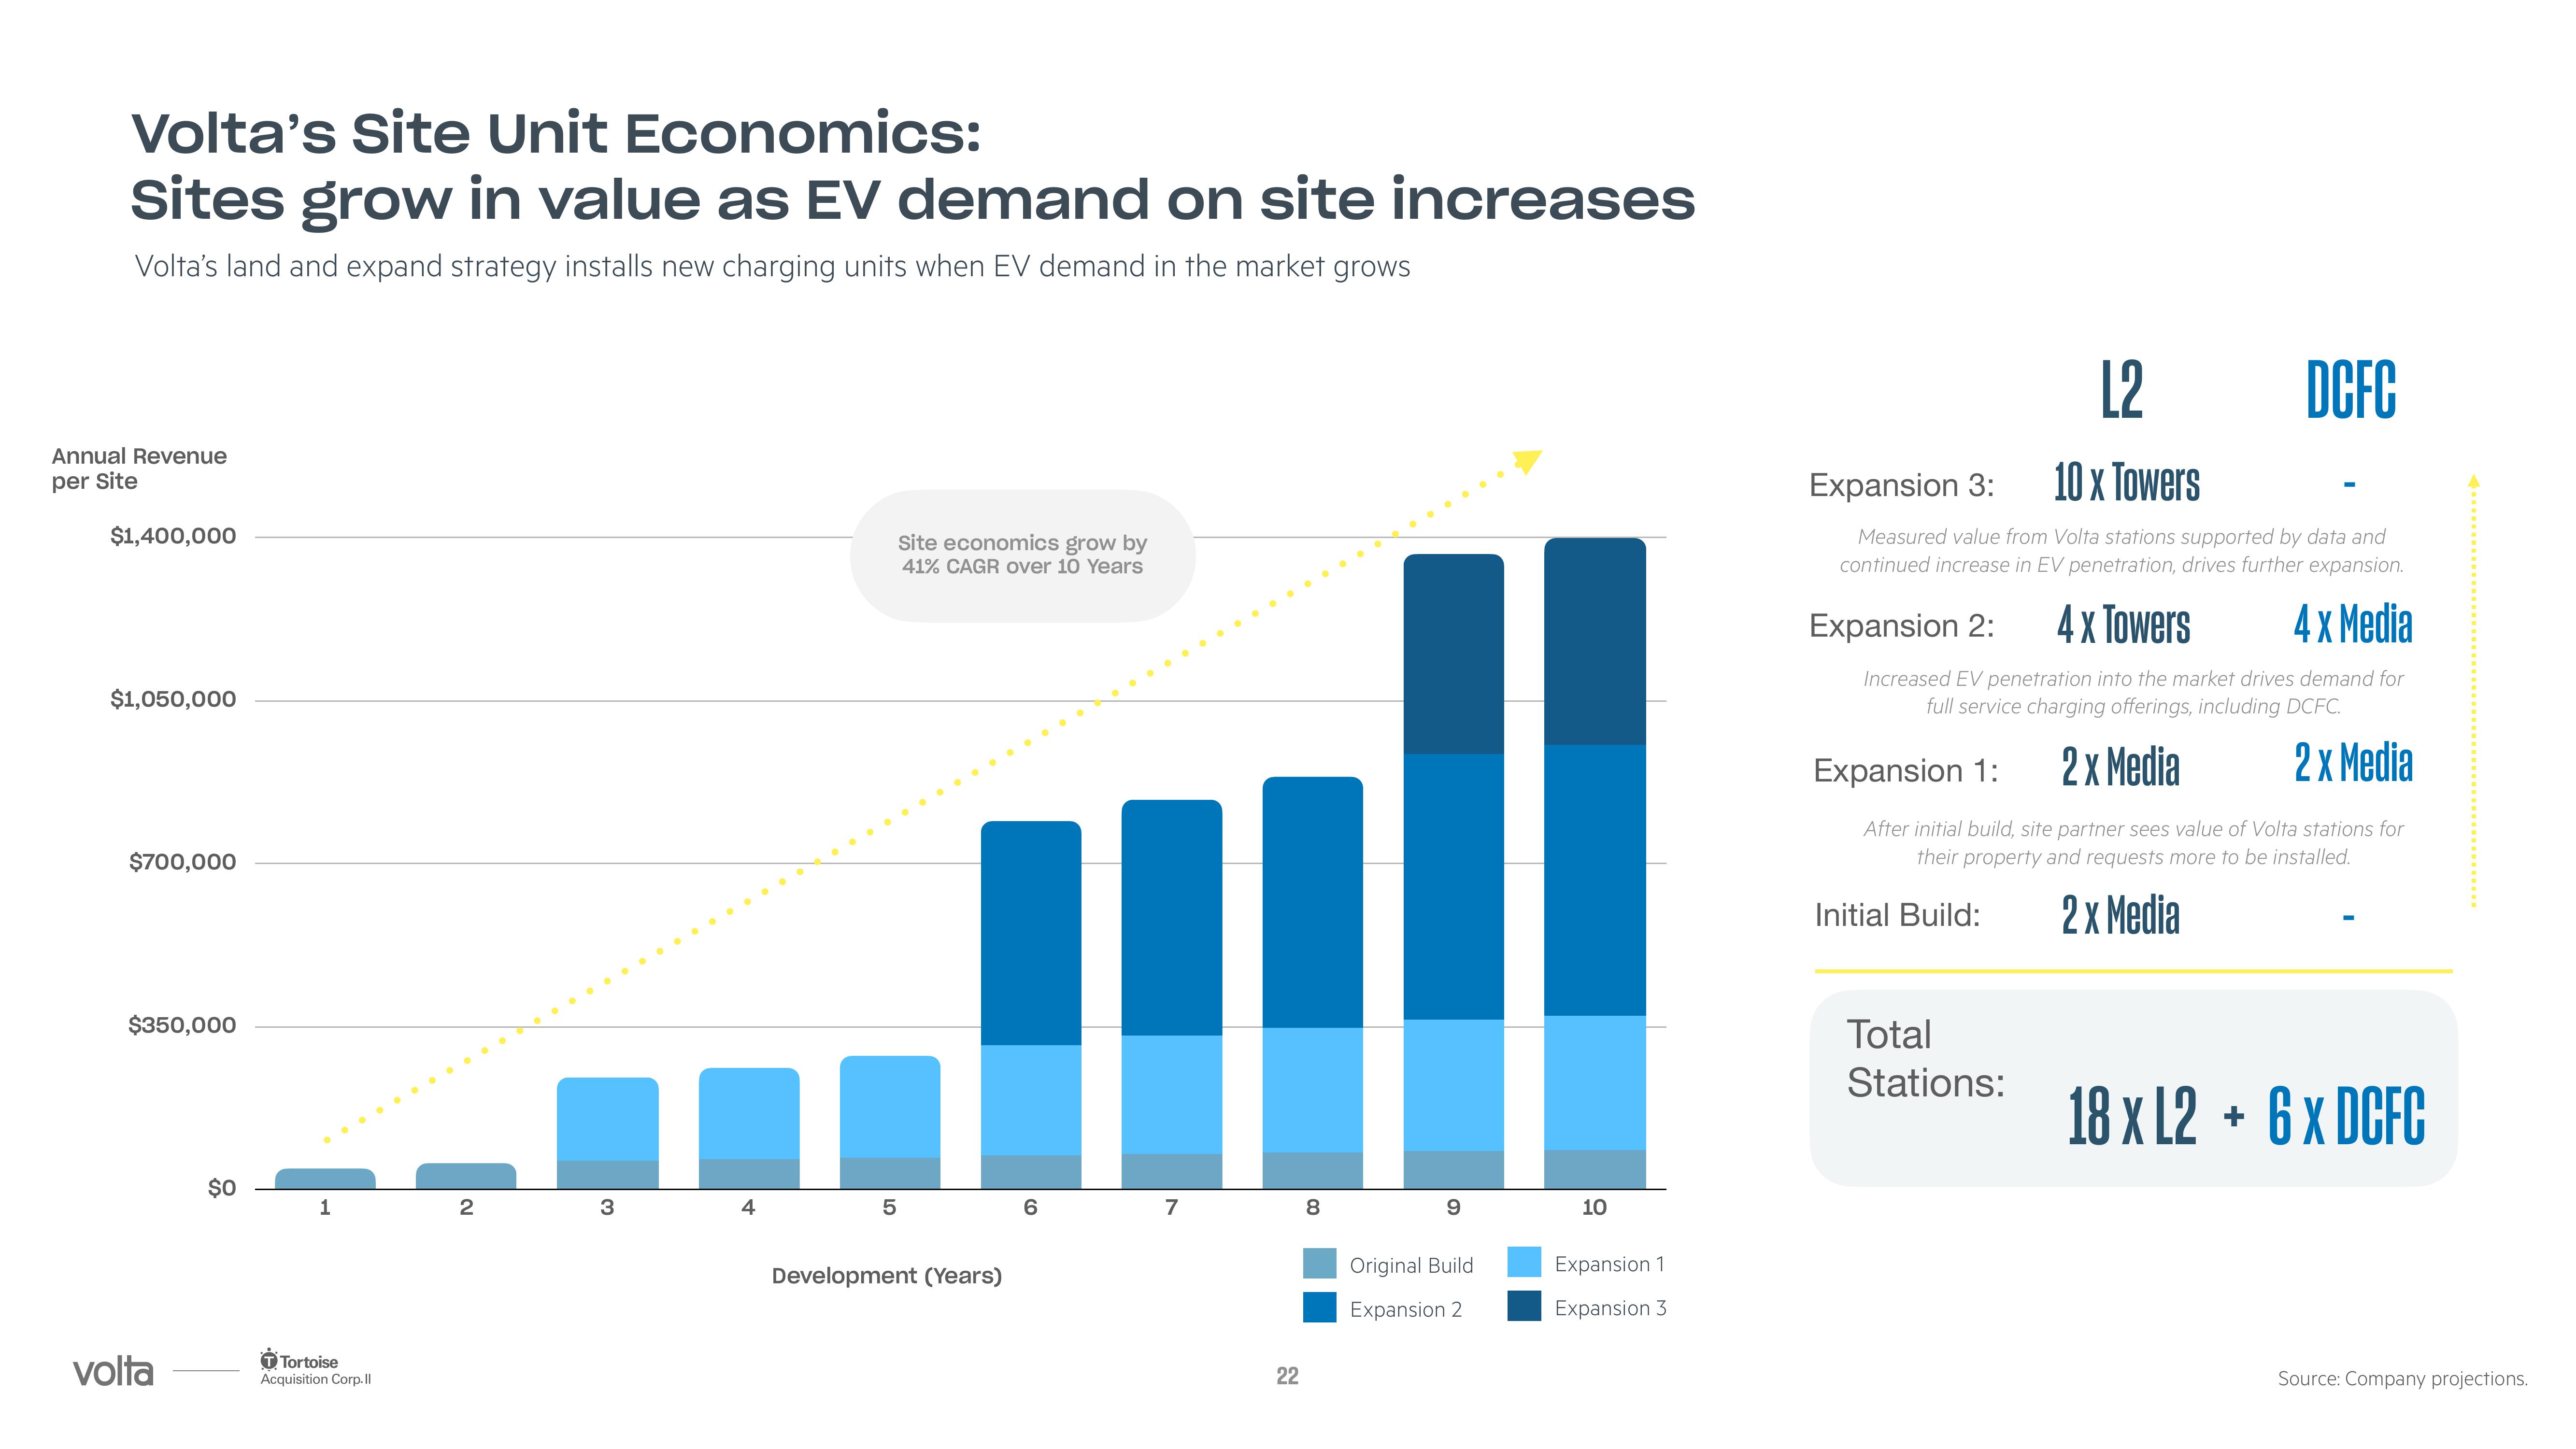
Volta's Site Unit Economics:
Sites grow in value as EV demand on site increases
Volta's land and expand strategy installs new charging units when EV demand in the market grows
Annual Revenue
per Site
$1,400,000
$1,050,000
$700,000
$350,000
volta
$0
1
Tortoise
Acquisition Corp.Il
2
3
L
4
Site economics grow by
41% CAGR over 10 Years
5
Development (Years)
6
7
22
8
9
Original Build
Expansion 2
10
Expansion 1
Expansion 3
L2
Expansion 3:
10 x Towers
Measured value from Volta stations supported by data and
continued increase in EV penetration, drives further expansion.
DCFC
Expansion 2: 4 x Towers
4 x Media
Increased EV penetration into the market drives demand for
full service charging offerings, including DCFC.
2x Media
2 x Media
Expansion 1:
After initial build, site partner sees value of Volta stations for
their property and requests more to be installed.
Initial Build:
2x Media
Total
Stations:
18 x L2 + 6 x DCFC
Source: Company projections.View entire presentation