Grove SPAC Presentation Deck
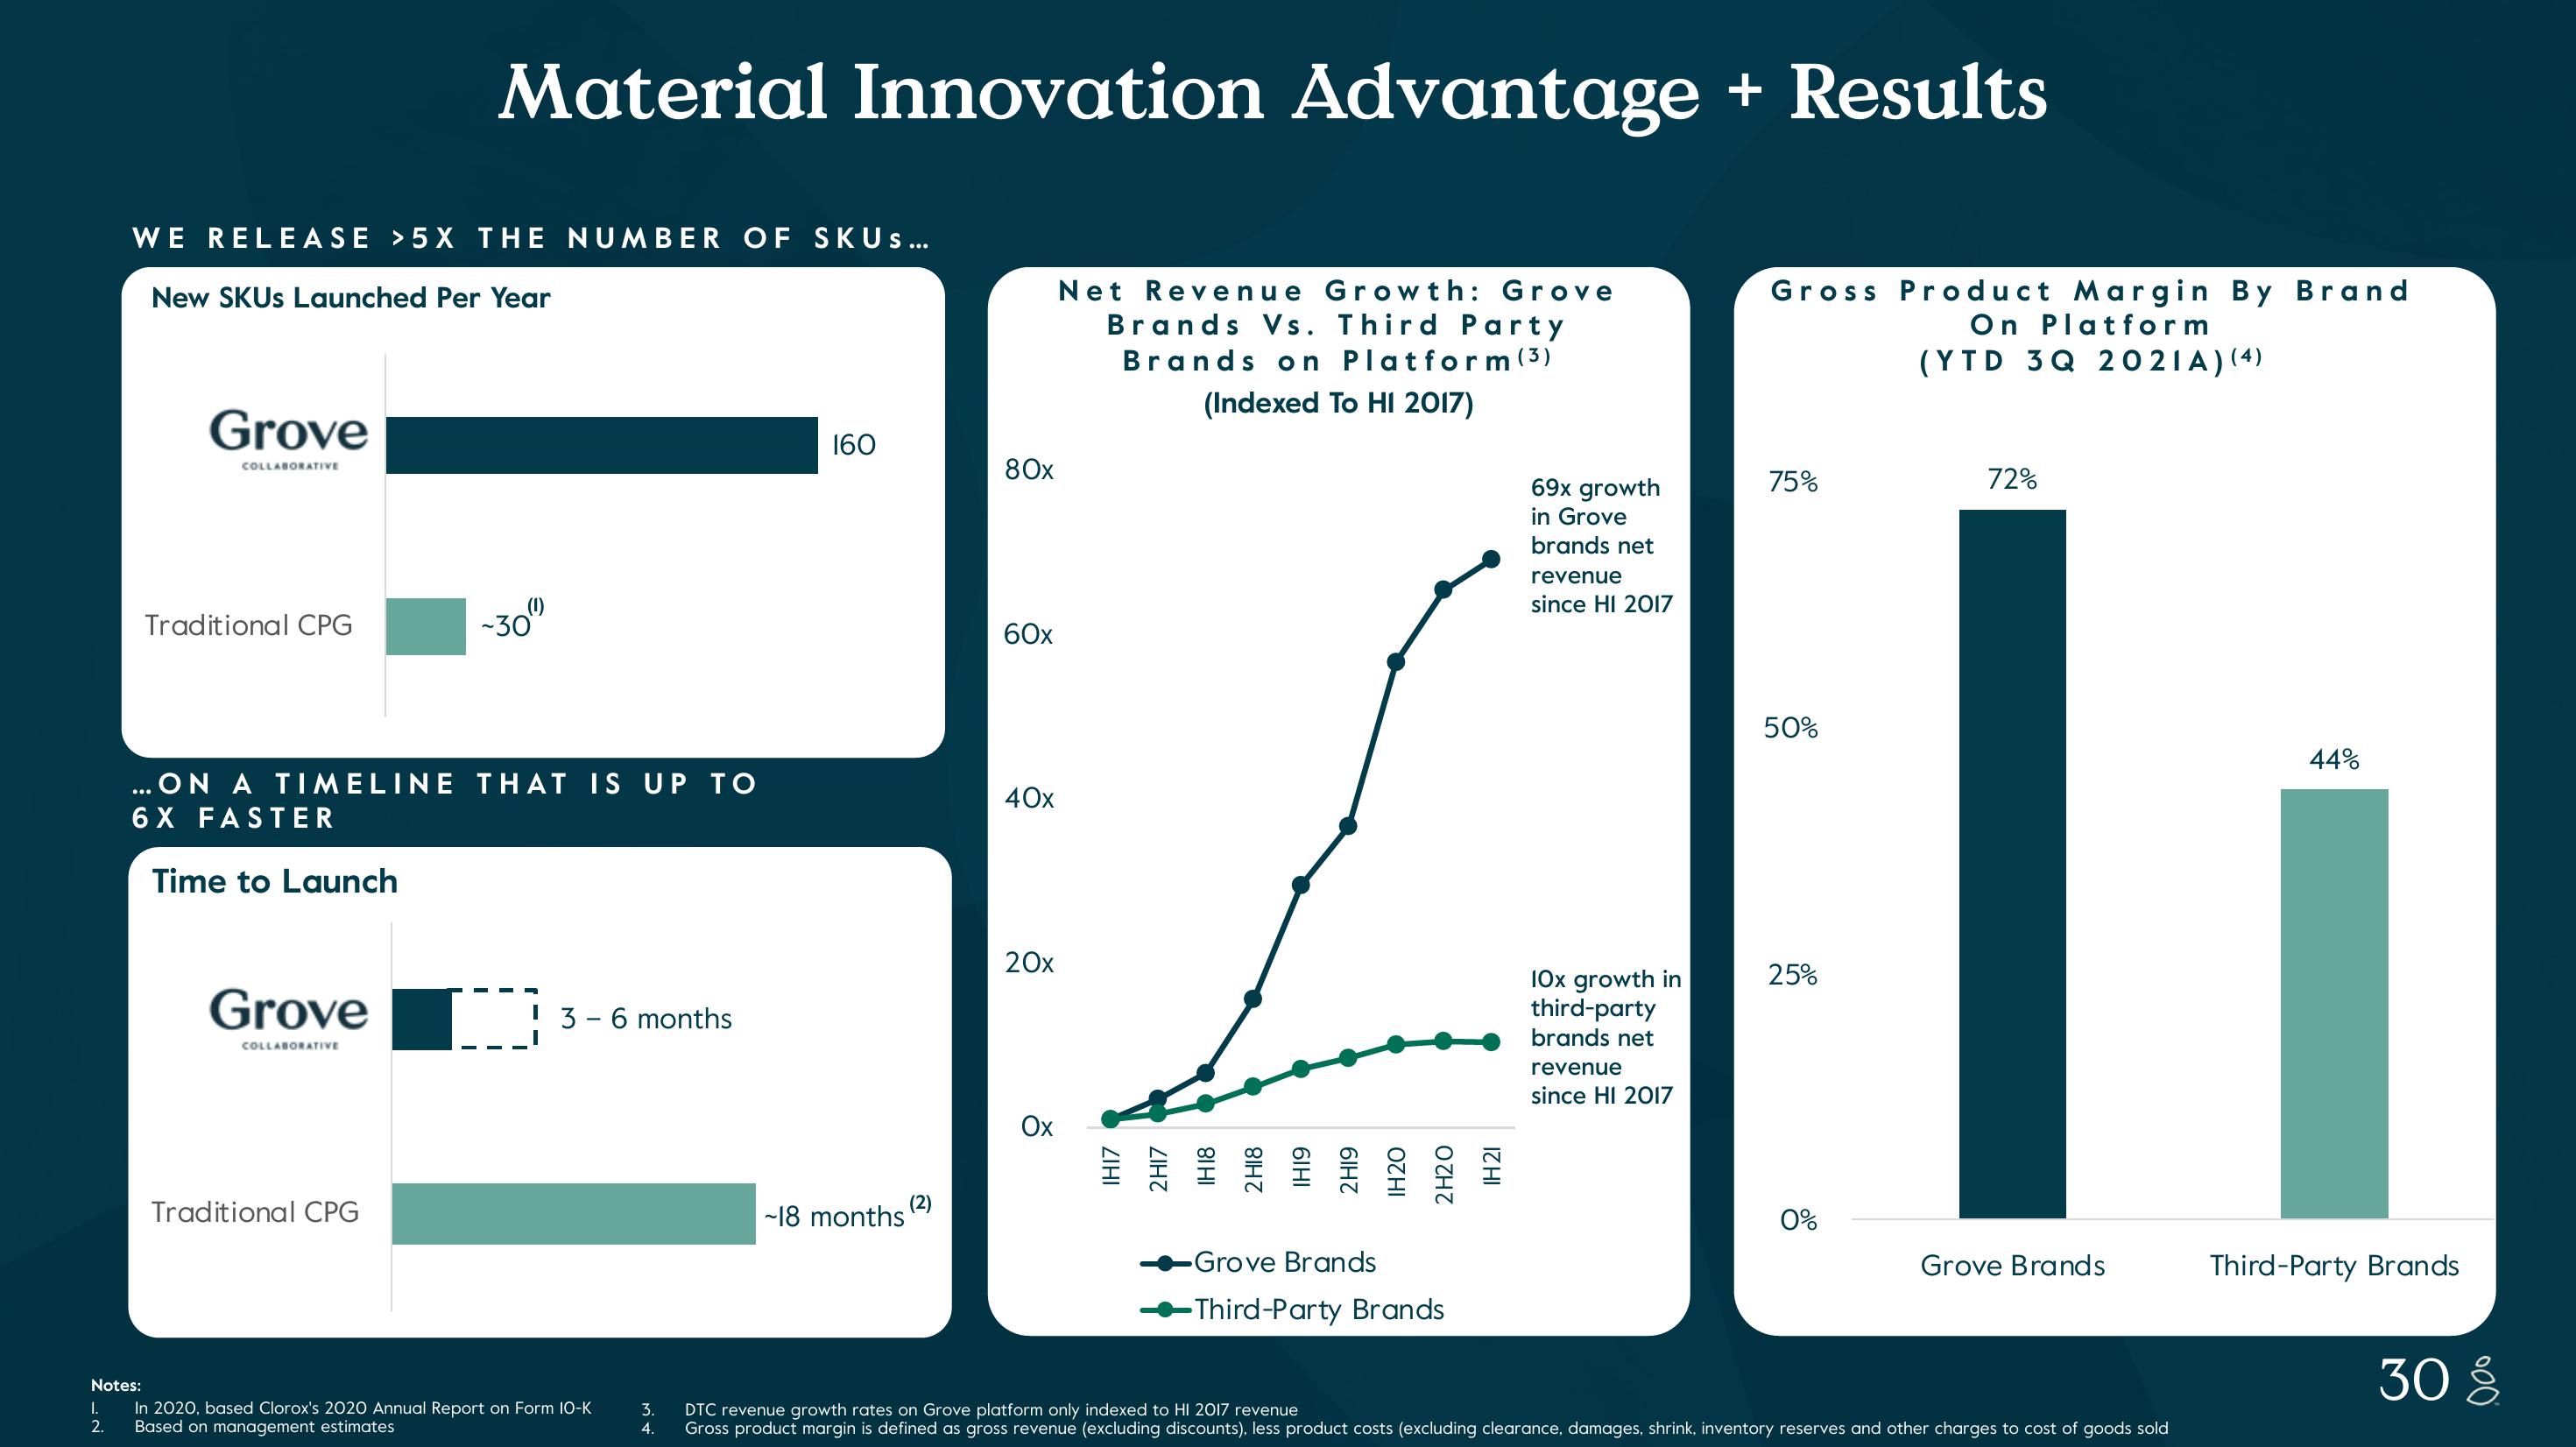
WE RELEASE >5X THE NUMBER OF SKUs...
New SKUs Launched Per Year
Grove
COLLABORATIVE
Traditional CPG
Material Innovation Advantage + Results
Grove
COLLABORATIVE
... ON A TIMELINE THAT IS UP TO
6 X FASTER
Time to Launch
Traditional CPG
-30
D 3 - 6 months
Notes:
I.
In 2020, based Clorox's 2020 Annual Report on Form 10-K
2.
Based on management estimates
3.
4.
160
-18 months
(2)
80x
60x
40x
20x
Ox
Net Revenue Growth: Grove
Brands Vs. Third Party
Brands on Platform (3)
(Indexed To HI 2017)
ZIHI
2H17
81 HI
2 H18
IHI9
2H19
IH20
2 H2O
IH 21
Grove Brands
Third-Party Brands
69x growth
in Grove
brands net
revenue
since HI 2017
10x growth in
third-party
brands net
revenue
since HI 2017
Gross Product Margin By Brand
On Platform
(YTD 3Q 2021A) (4)
75%
50%
25%
0%
72%
Grove Brands
DTC revenue growth rates on Grove platform only indexed to HI 2017 revenue
Gross product margin is defined as gross revenue (excluding discounts), less product costs (excluding clearance, damages, shrink, inventory reserves and other charges to cost of goods sold
44%
Third-Party Brands
30 8View entire presentation