Pathward Financial Results Presentation Deck
SELECTED BALANCE SHEET HIGHLIGHTS
SECOND QUARTER ENDED MARCH 31, 2021
7
BALANCE SHEET
($ in thousands)
Cash and cash equivalents
Loans and leases (HFI)
Allowance for credit losses
Total assets
Noninterest-bearing checking
Total deposits
Total liabilities
Total stockholders' equity
Total liabilities and stockholders equity
Loans / Deposits
Net Interest Margin
Return on Average Assets
Return on Average Equity
$
2Q21
3,724,242
3,657,531
(98,892)
9,790,123
7,928,235
8,642,413
8,954,865
835,258
9,790,123
●
42%
3.07%
2.22%
28.93 %
PERIOD ENDING
1Q21
1,586,451
3,448,675
(72,389)
$ 7,264,515
5,581,597
6,207,791
6,451,305
813,210
7,264,515
$
56%
4.65%
1.73%
13.91%
$
2Q20
108,733
3,618,924
(65,355)
5,843,865
2,900,484
3,962,404
5,038,791
805,074
5,843,865
91%
4.78 %
3.16%
25.15%
AVERAGE
2Q21
4,187,558
4,120,555
(86,591)
$ 10,655,852
8,967,067
9,565,560
9,839,173
816,679
$ 10,655,852
43 %
3.07 %
2.22%
28.93 %
$
QUARTERLY INVESTOR UPDATE | SECOND QUARTER FISCAL YEAR 2021 | NASDAQ: CASH
$
2Q20
196,754
4,195,772
(41,537)
6,610,899
3,199,148
5,057,293
5,779,060
831,839
6,610,889
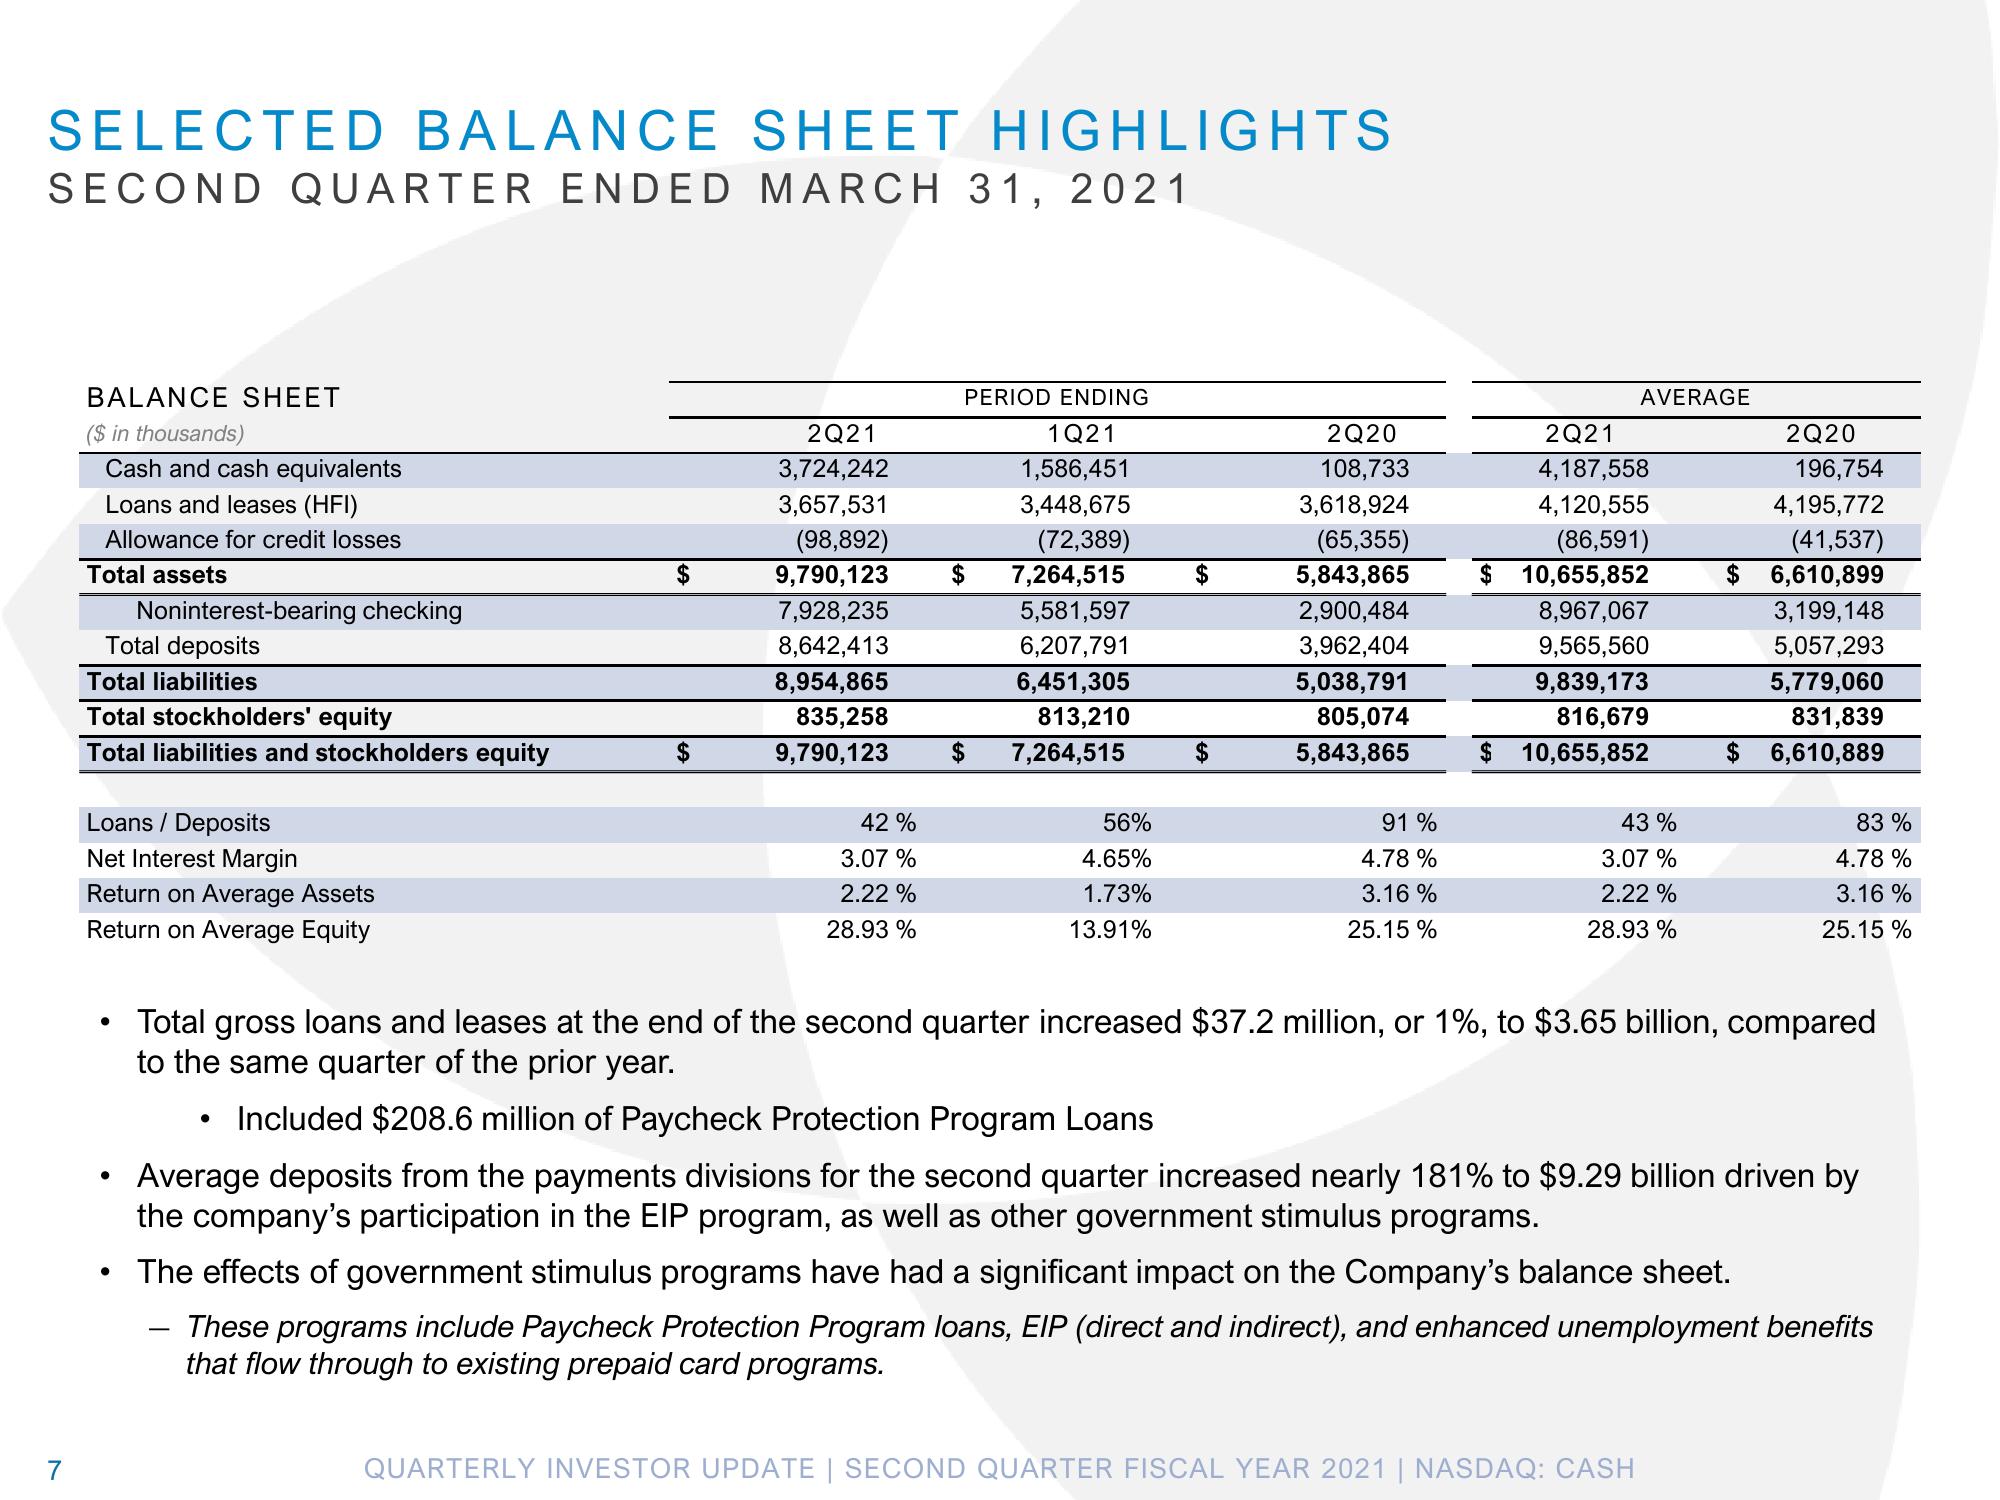
• Total gross loans and leases at the end of the second quarter increased $37.2 million, or 1%, to $3.65 billion, compared
to the same quarter of the prior year.
83%
4.78%
3.16%
25.15 %
Included $208.6 million of Paycheck Protection Program Loans
Average deposits from the payments divisions for the second quarter increased nearly 181% to $9.29 billion driven by
the company's participation in the EIP program, as well as other government stimulus programs.
The effects of government stimulus programs have had a significant impact on the Company's balance sheet.
These programs include Paycheck Protection Program loans, EIP (direct and indirect), and enhanced unemployment benefits
that flow through to existing prepaid card programs.View entire presentation