Bed Bath & Beyond Results Presentation Deck
Q2 2020 FINANCIAL RESULTS
unlocked strong cash flow generation of >$750mn;
total liquidity of -$2.2bn
Q2 actions enhanced cash & liquidity:
.
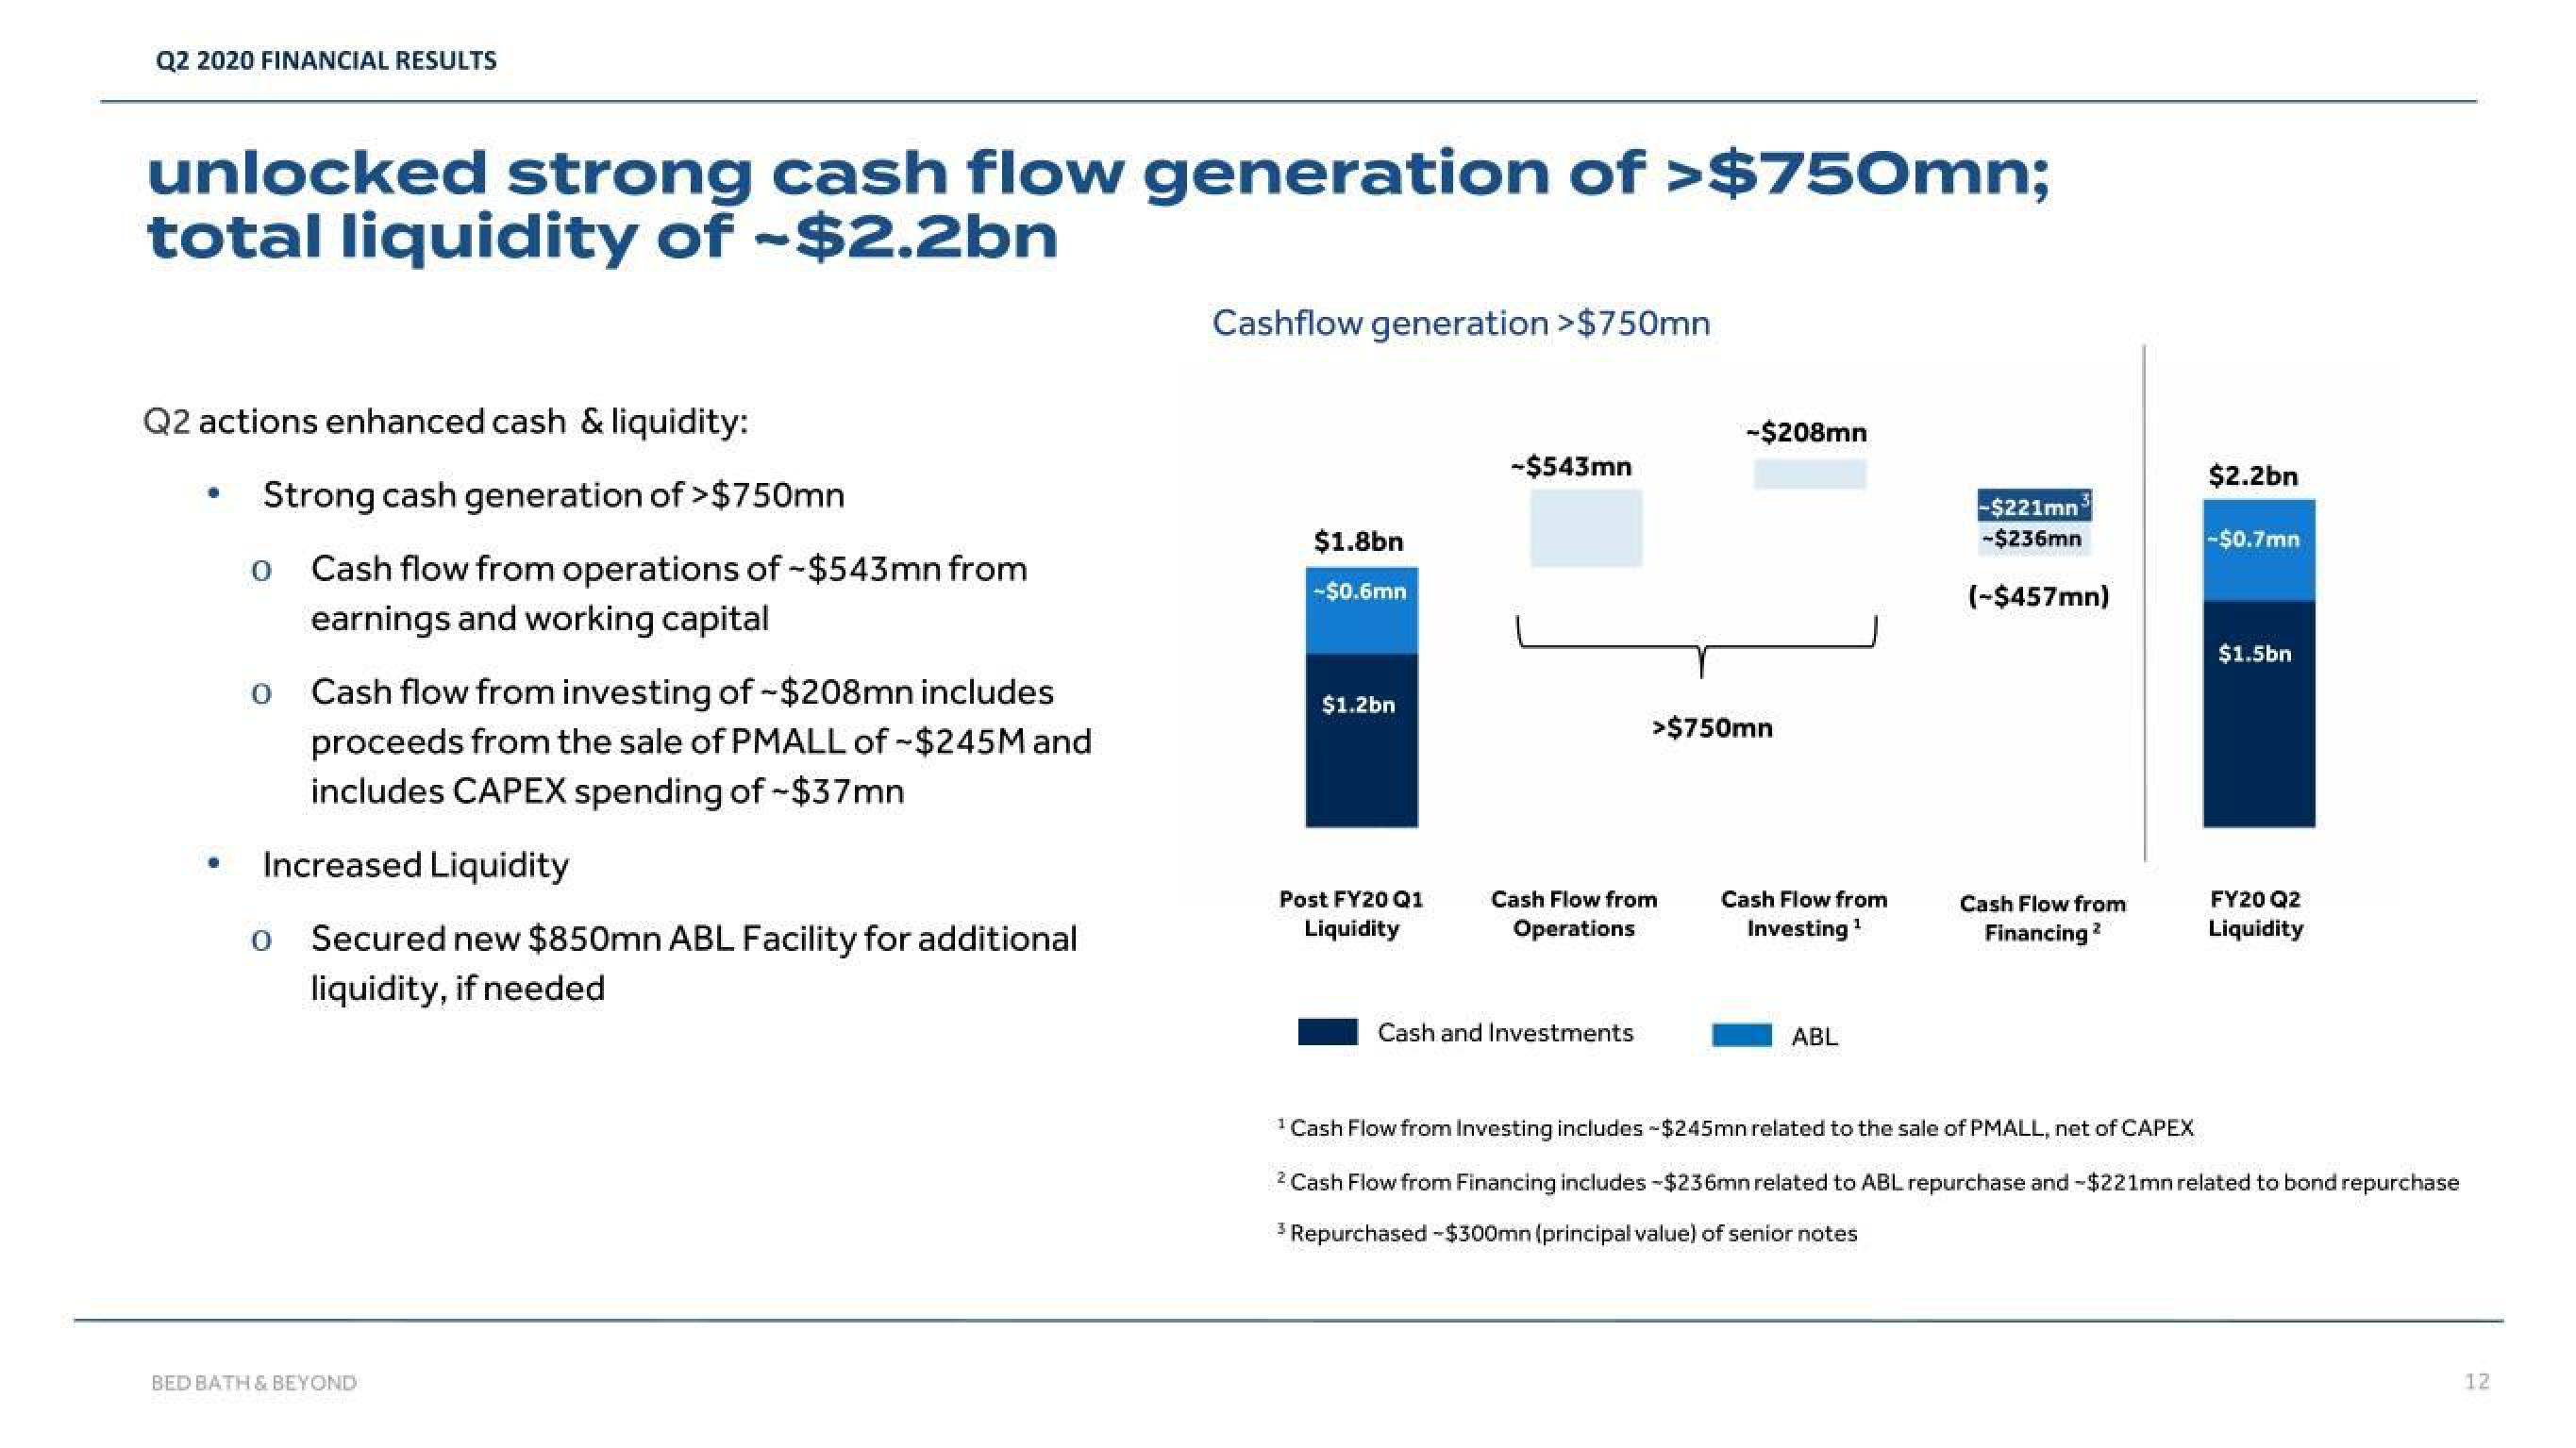
Strong cash generation of >$750mn
Cash flow from operations of -$543mn from
earnings and working capital
0
Cash flow from investing of - $208mn includes
proceeds from the sale of PMALL of -$245M and
includes CAPEX spending of -$37mn
Increased Liquidity
Secured new $850mn ABL Facility for additional
liquidity, if needed
0
0
BED BATH & BEYOND
Cashflow generation >$750mn
$1.8bn
-$0.6mn
$1.2bn
Post FY20 Q1
Liquidity
-$543mn
Cash Flow from
Operations
Cash and Investments
-$208mn
>$750mn
Cash Flow from
Investing ¹
ABL
-$221mn
-$236mn
(-$457mn)
Cash Flow from
Financing 2
$2.2bn
-$0.7mn
$1.5bn
FY20 Q2
Liquidity
¹ Cash Flow from Investing includes -$245mn related to the sale of PMALL, net of CAPEX
2 Cash Flow from Financing includes -$236mn related to ABL repurchase and - $221mn related to bond repurchase
3 Repurchased -$300mn (principal value) of senior notes
12View entire presentation