Nestle Results Presentation Deck slide image

Nestle Results Presentation Deck

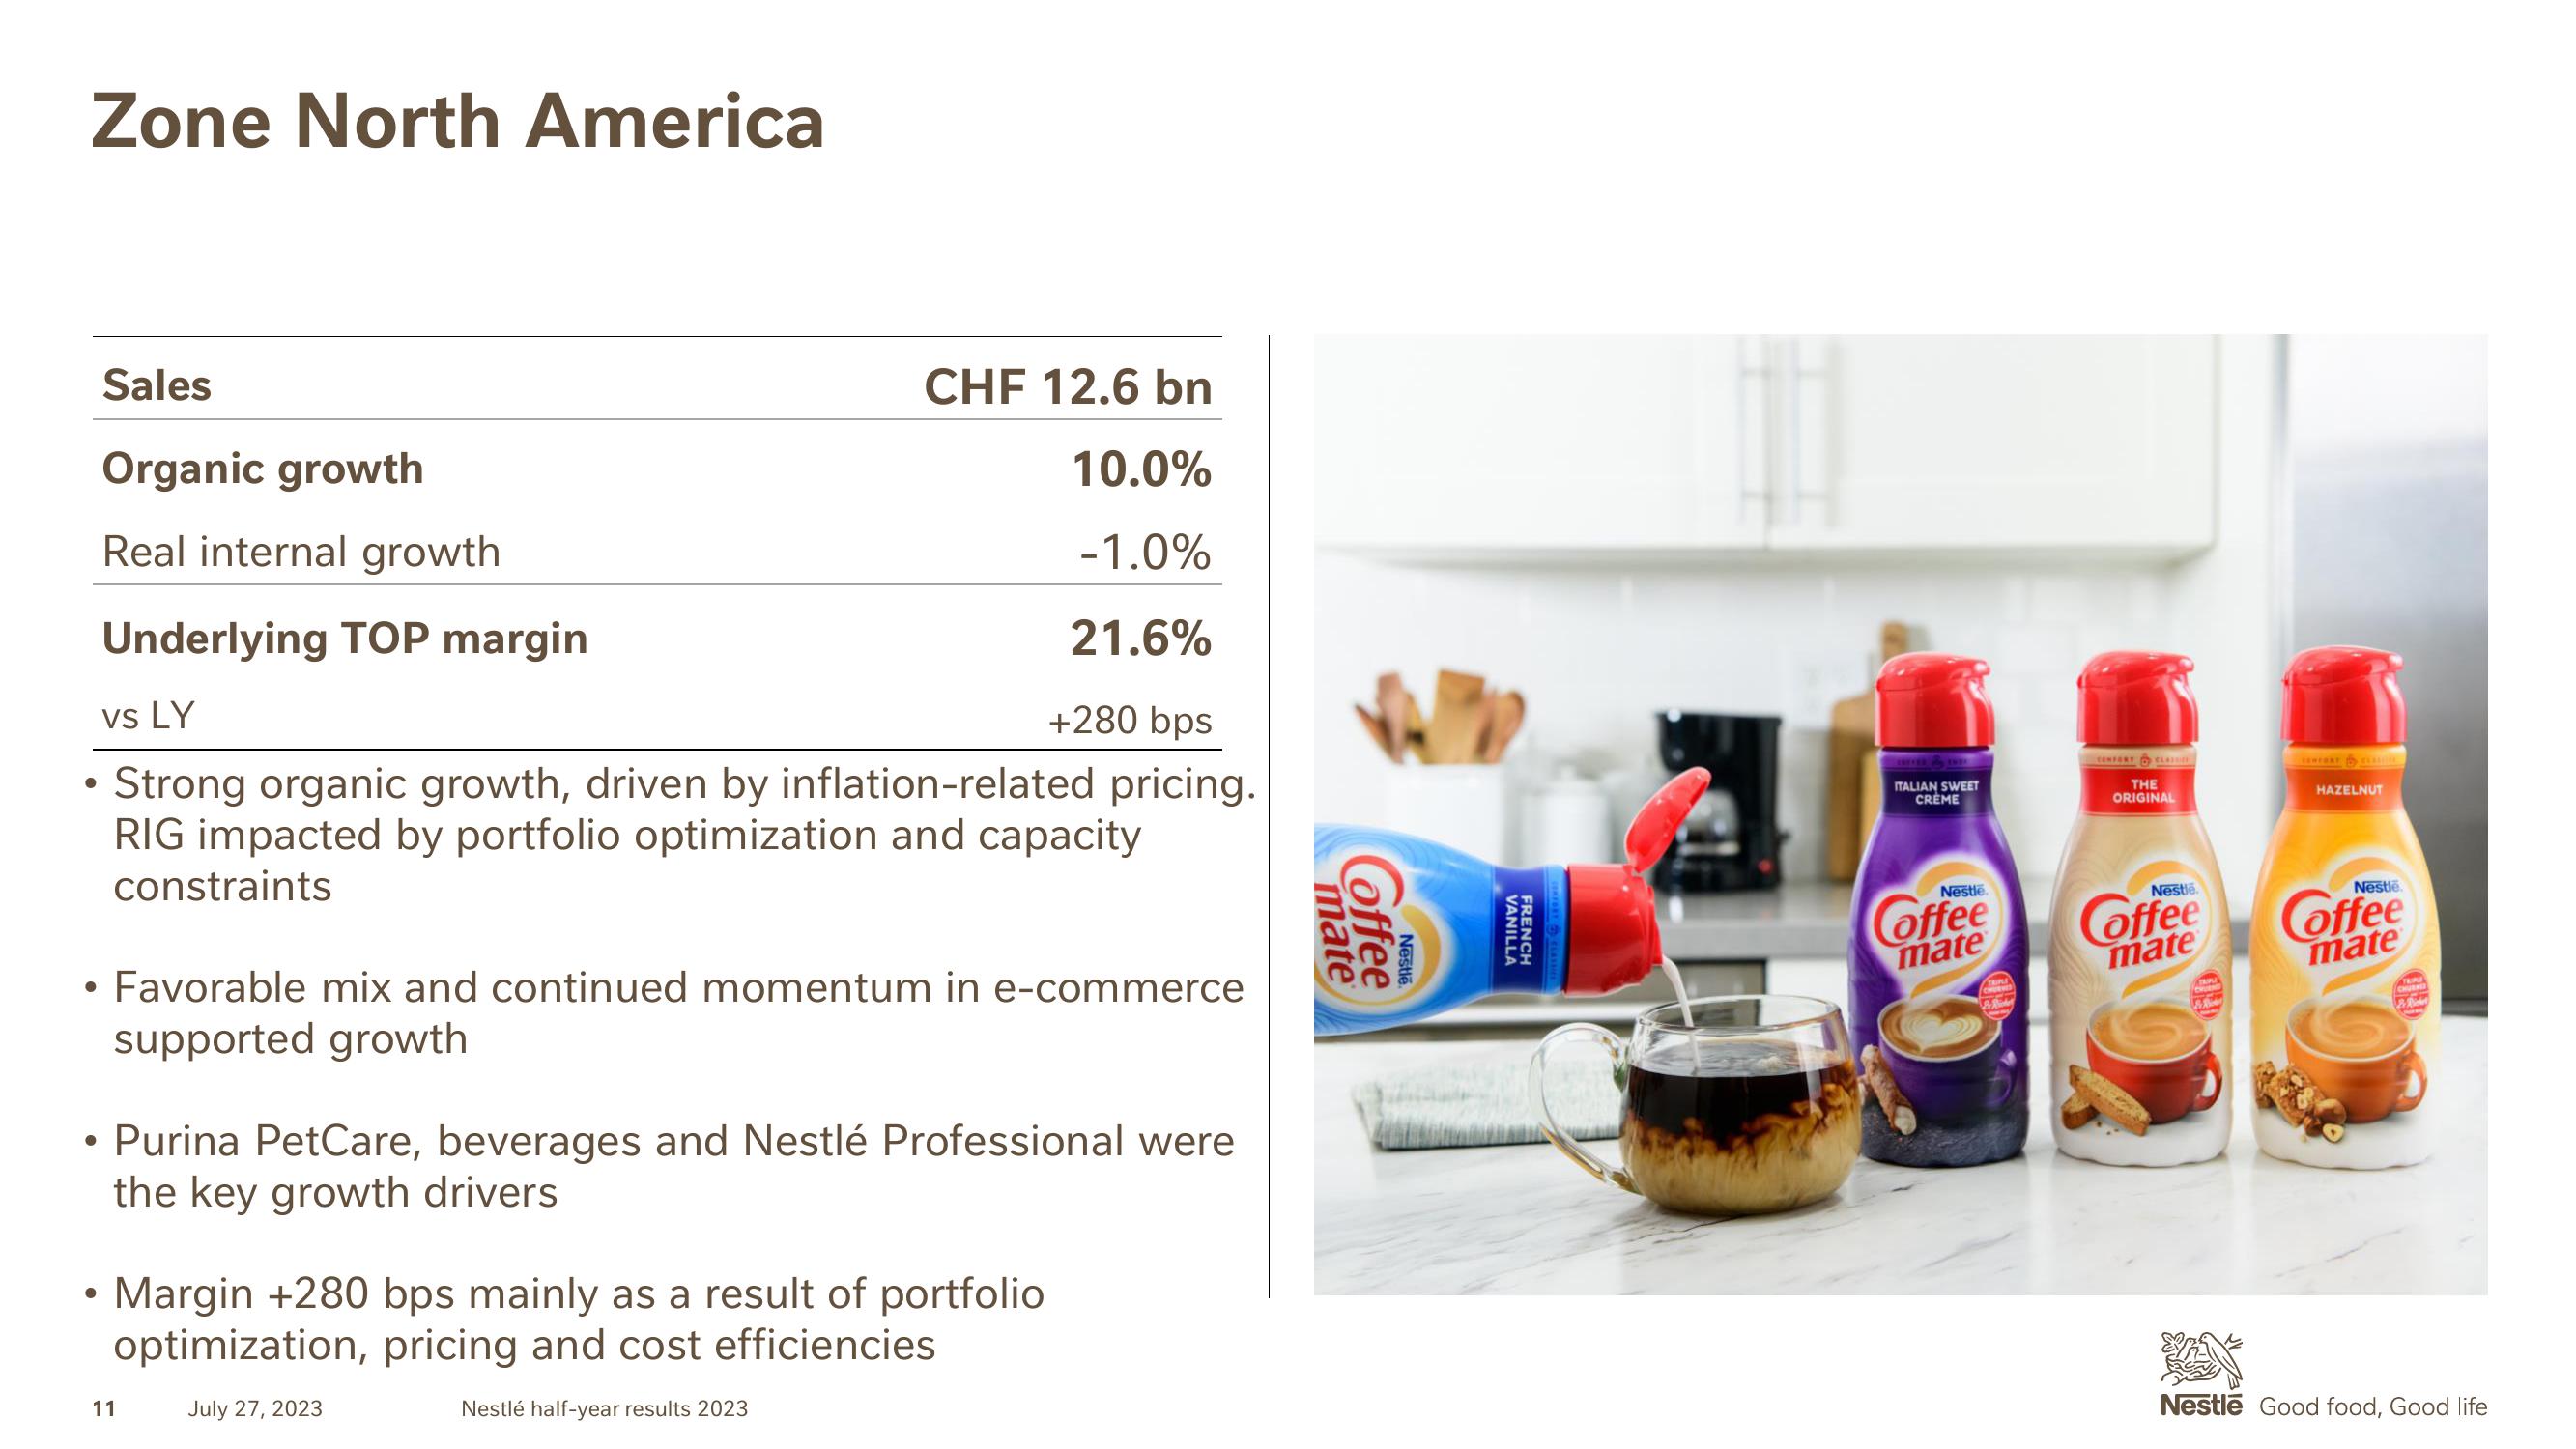
Zone North America ● ● Sales Organic growth Real internal growth ● CHF 12.6 bn 10.0% -1.0% 21.6% Underlying TOP margin vs LY +280 bps Strong organic growth, driven by inflation-related pricing. RIG impacted by portfolio optimization and capacity constraints Favorable mix and continued momentum in e-commerce supported growth • Purina PetCare, beverages and Nestlé Professional were the key growth drivers Margin +280 bps mainly as a result of portfolio optimization, pricing and cost efficiencies July 27, 2023 Nestlé half-year results 2023 11 Coffee mate Nestle VANILLA FRENCH ITALIAN SWEET CREME Nestle mate CENFERT CLASS THE ORIGINAL Nestle. Coffee mate & HAZELNUT Coffee mate CHUBAD & Richt Nestle Good food, Good life
View entire presentation