Plastiq SPAC Presentation Deck
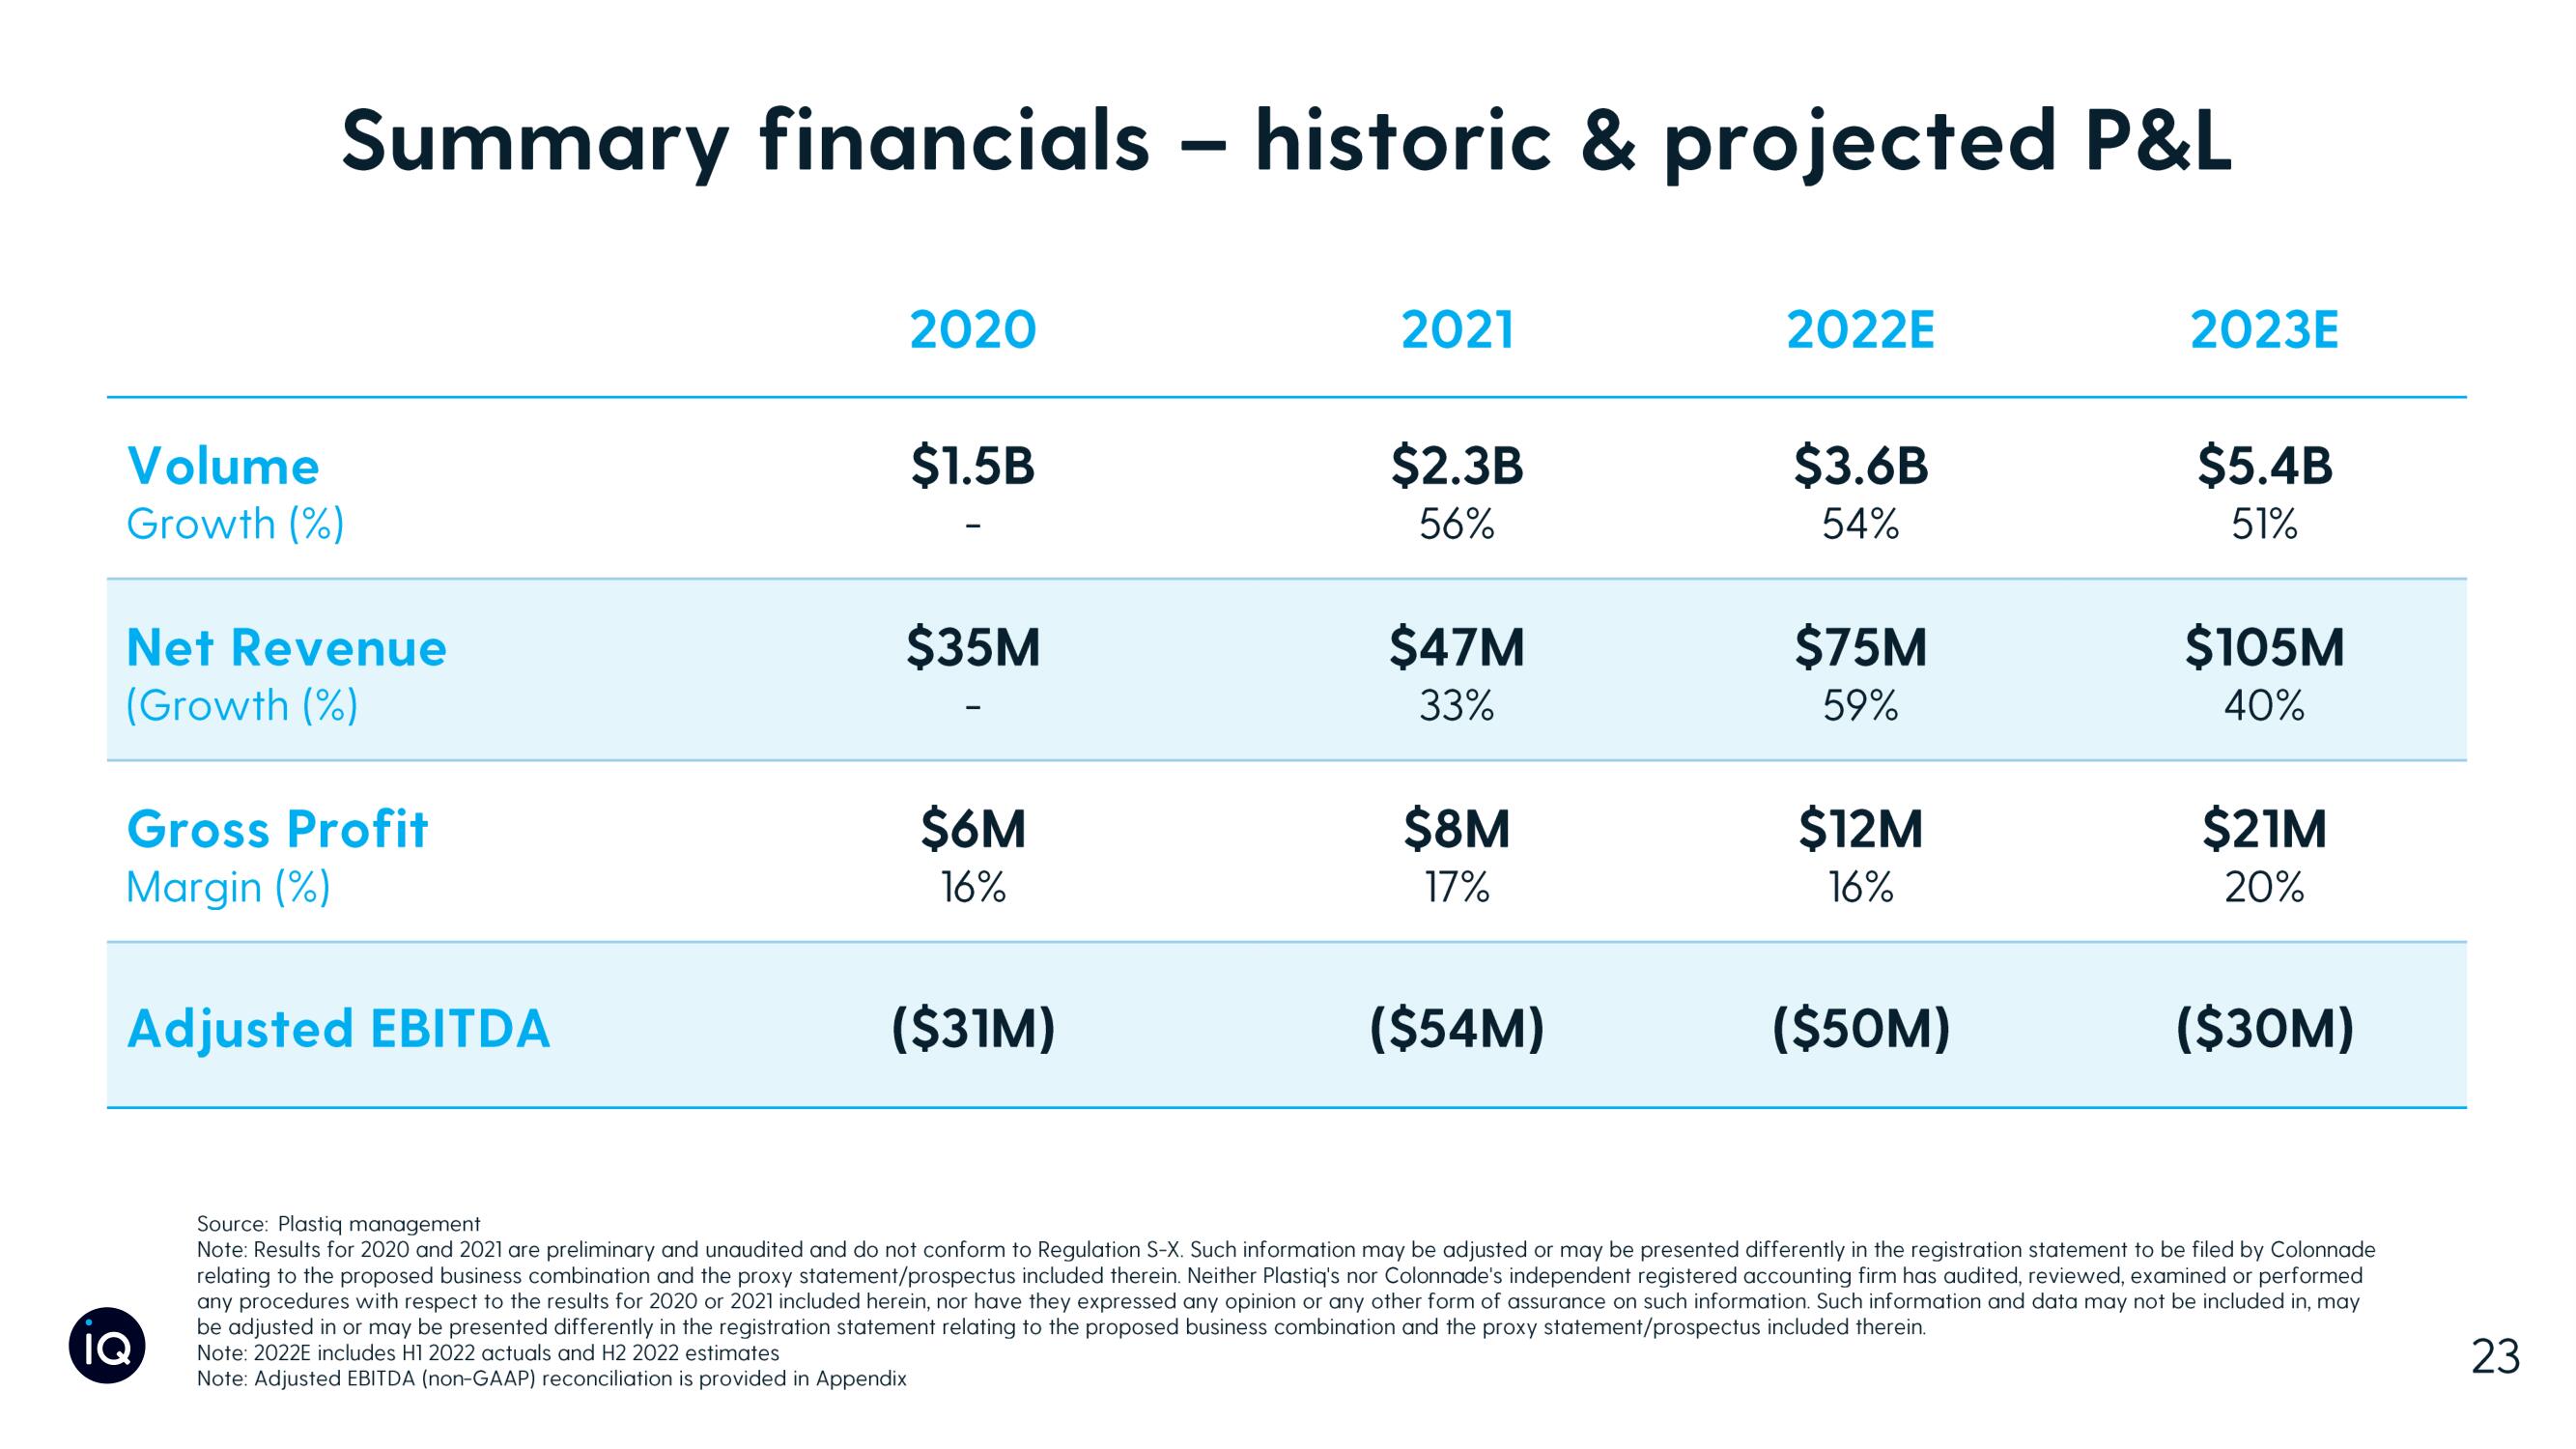
Summary financials - historic & projected P&L
Volume
Growth (%)
Net Revenue
(Growth (%)
Gross Profit
Margin (%)
Adjusted EBITDA
IQ
2020
$1.5B
$35M
$6M
16%
($31M)
2021
$2.3B
56%
$47M
33%
$8M
17%
($54M)
2022E
$3.6B
54%
$75M
59%
$12M
16%
($50M)
2023E
$5.4B
51%
$105M
40%
$21M
20%
($30M)
Source: Plastiq management
Note: Results for 2020 and 2021 are preliminary and unaudited and do not conform to Regulation S-X. Such information may be adjusted or may be presented differently in the registration statement to be filed by Colonnade
relating to the proposed business combination and the proxy statement/prospectus included therein. Neither Plastiq's nor Colonnade's independent registered accounting firm has audited, reviewed, examined or performed
any procedures with respect to the results for 2020 or 2021 included herein, nor have they expressed any opinion or any other form of assurance on such information. Such information and data may not be included in, may
be adjusted in or may be presented differently in the registration statement relating to the proposed business combination and the proxy statement/prospectus included therein.
Note: 2022E includes H1 2022 actuals and H2 2022 estimates
Note: Adjusted EBITDA (non-GAAP) reconciliation is provided in Appendix
23View entire presentation