Barclays Global Financial Services Conference
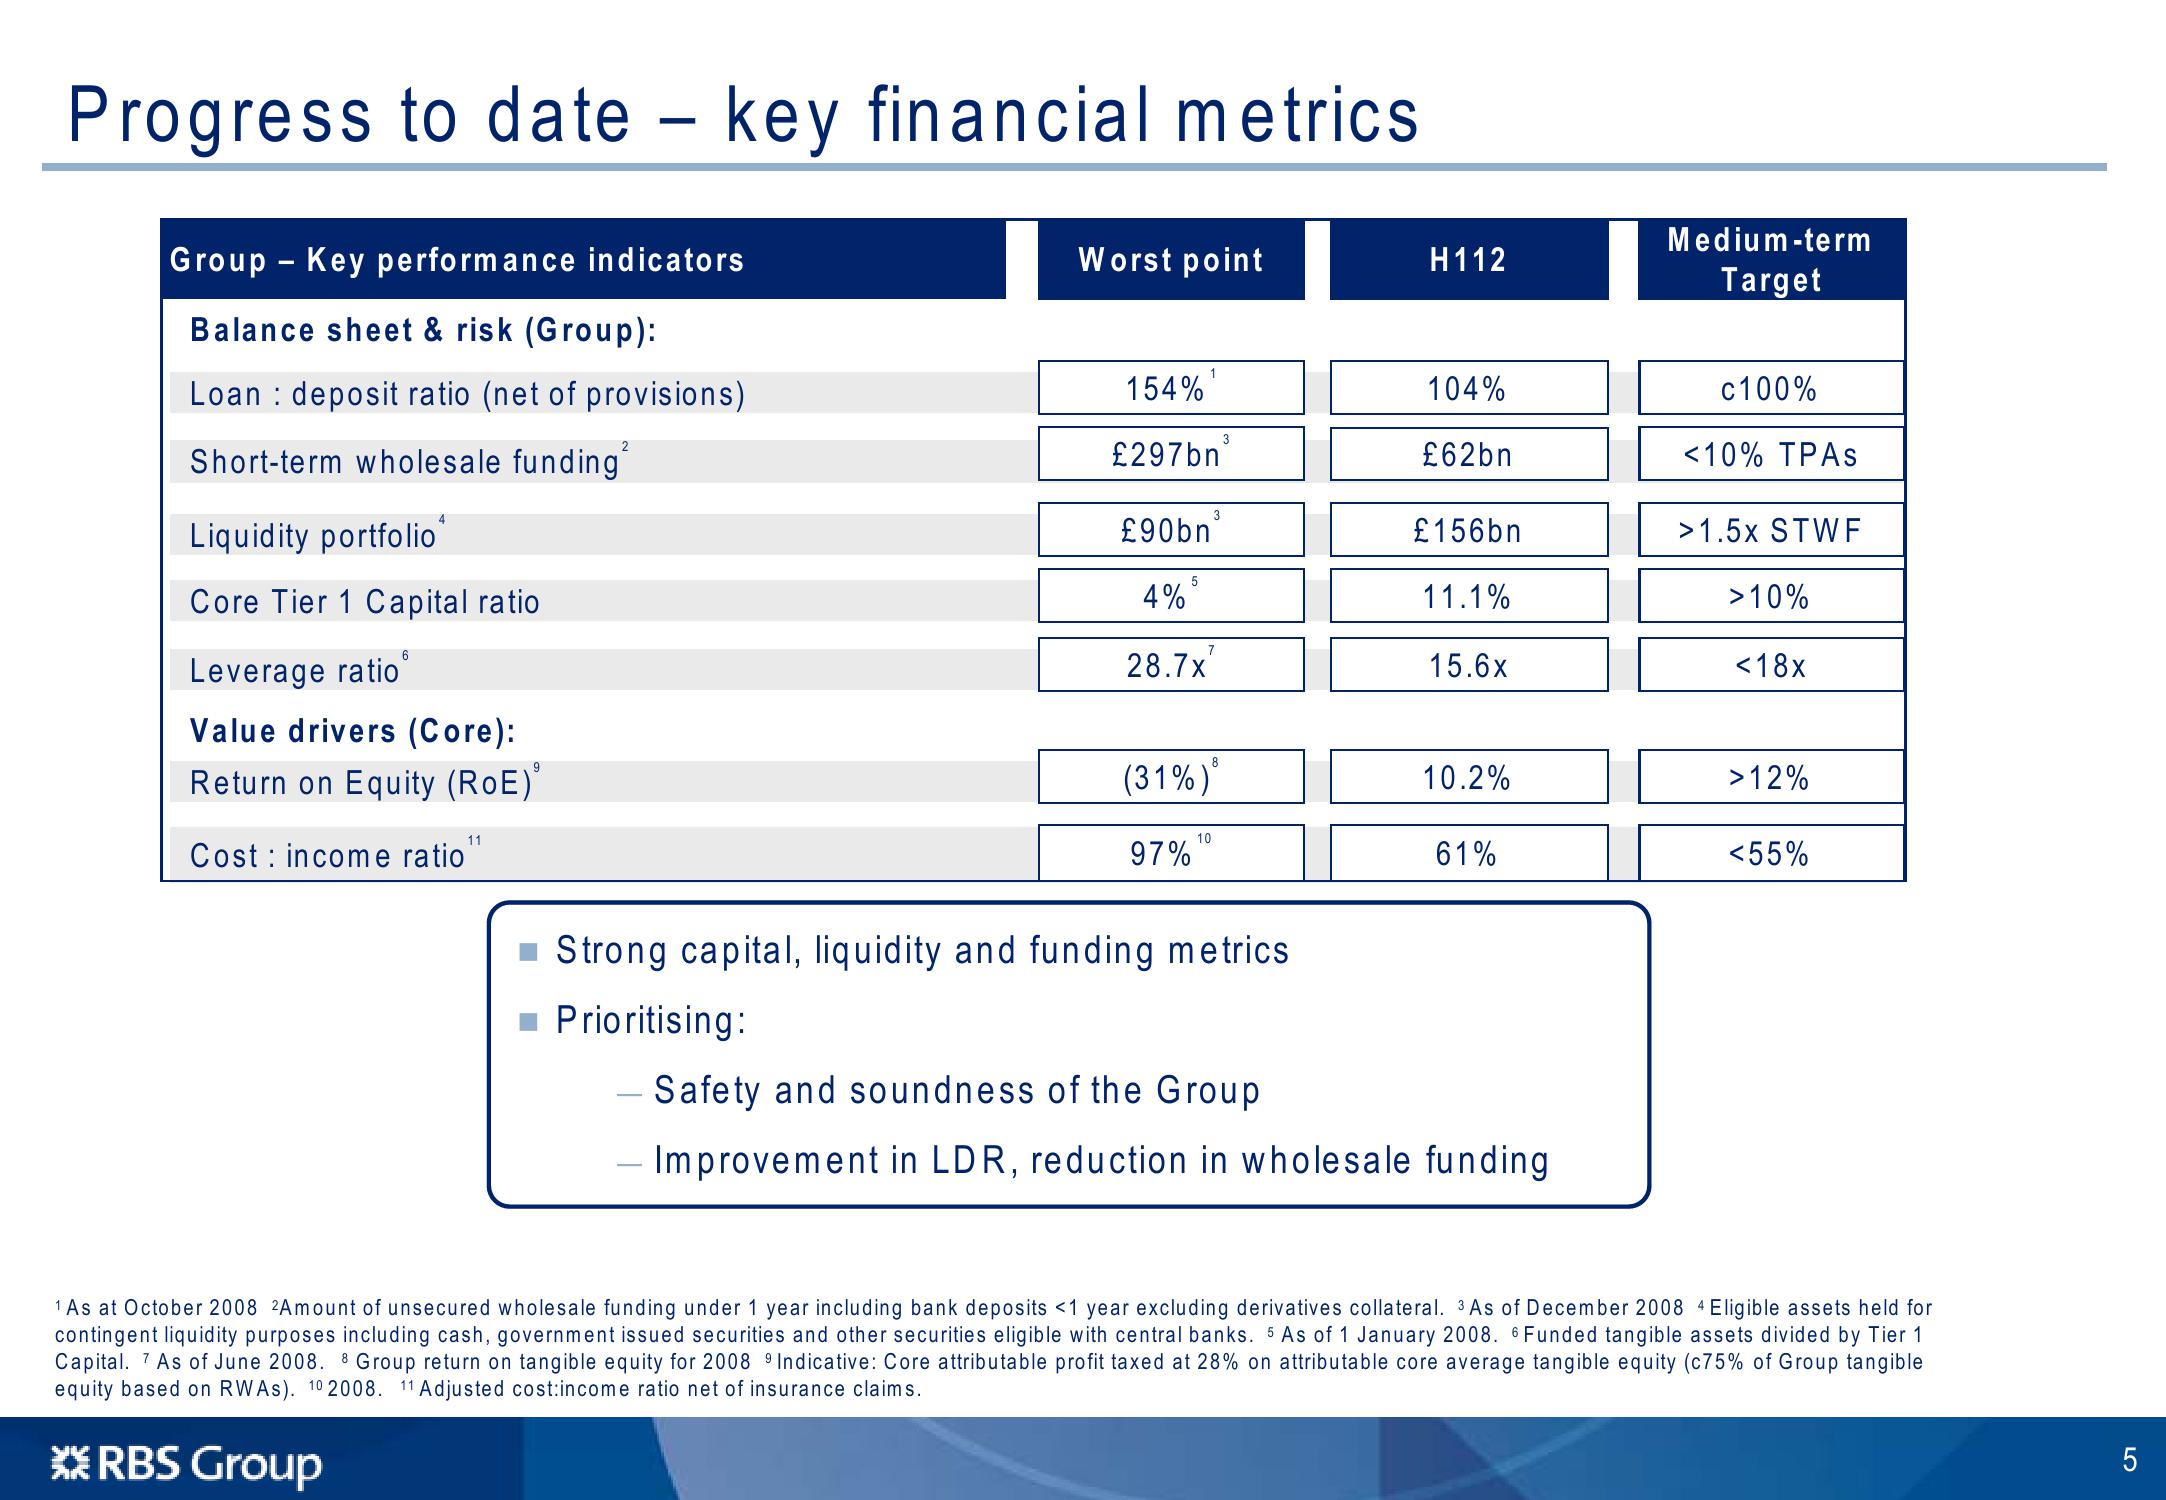
Progress to date key financial metrics.
-
-
Group Key performance indicators
Balance sheet & risk (Group):
Loan deposit ratio (net of provisions)
Worst point
H112
Medium-term
Target
Short-term wholesale funding
Liquidity portfolio*
Core Tier 1 Capital ratio
Leverage ratio
6
Value drivers (Core):
Return on Equity (ROE)'
11
Cost income ratio
1
154%
104%
c100%
3
£297bn
£62bn
<10% TPAS
3
£90bn
£156bn
>1.5x STWF
5
4%
11.1%
>10%
7
28.7x
15.6x
<18x
8
(31%)
10.2%
>12%
10
97%
61%
<55%
■Strong capital, liquidity and funding metrics.
■ Prioritising:
- Safety and soundness of the Group
- Improvement in LDR, reduction in wholesale funding
1 As at October 2008 2Amount of unsecured wholesale funding under 1 year including bank deposits <1 year excluding derivatives collateral. 3 As of December 2008 4 Eligible assets held for
contingent liquidity purposes including cash, government issued securities and other securities eligible with central banks. 5 As of 1 January 2008. 6 Funded tangible assets divided by Tier 1
Capital. As of June 2008. 8 Group return on tangible equity for 2008 9 Indicative: Core attributable profit taxed at 28% on attributable core average tangible equity (c75% of Group tangible
equity based on RWAs). 10 2008. 11 Adjusted cost:income ratio net of insurance claims.
**RBS Group
5View entire presentation