Credit Suisse Investment Banking Pitch Book
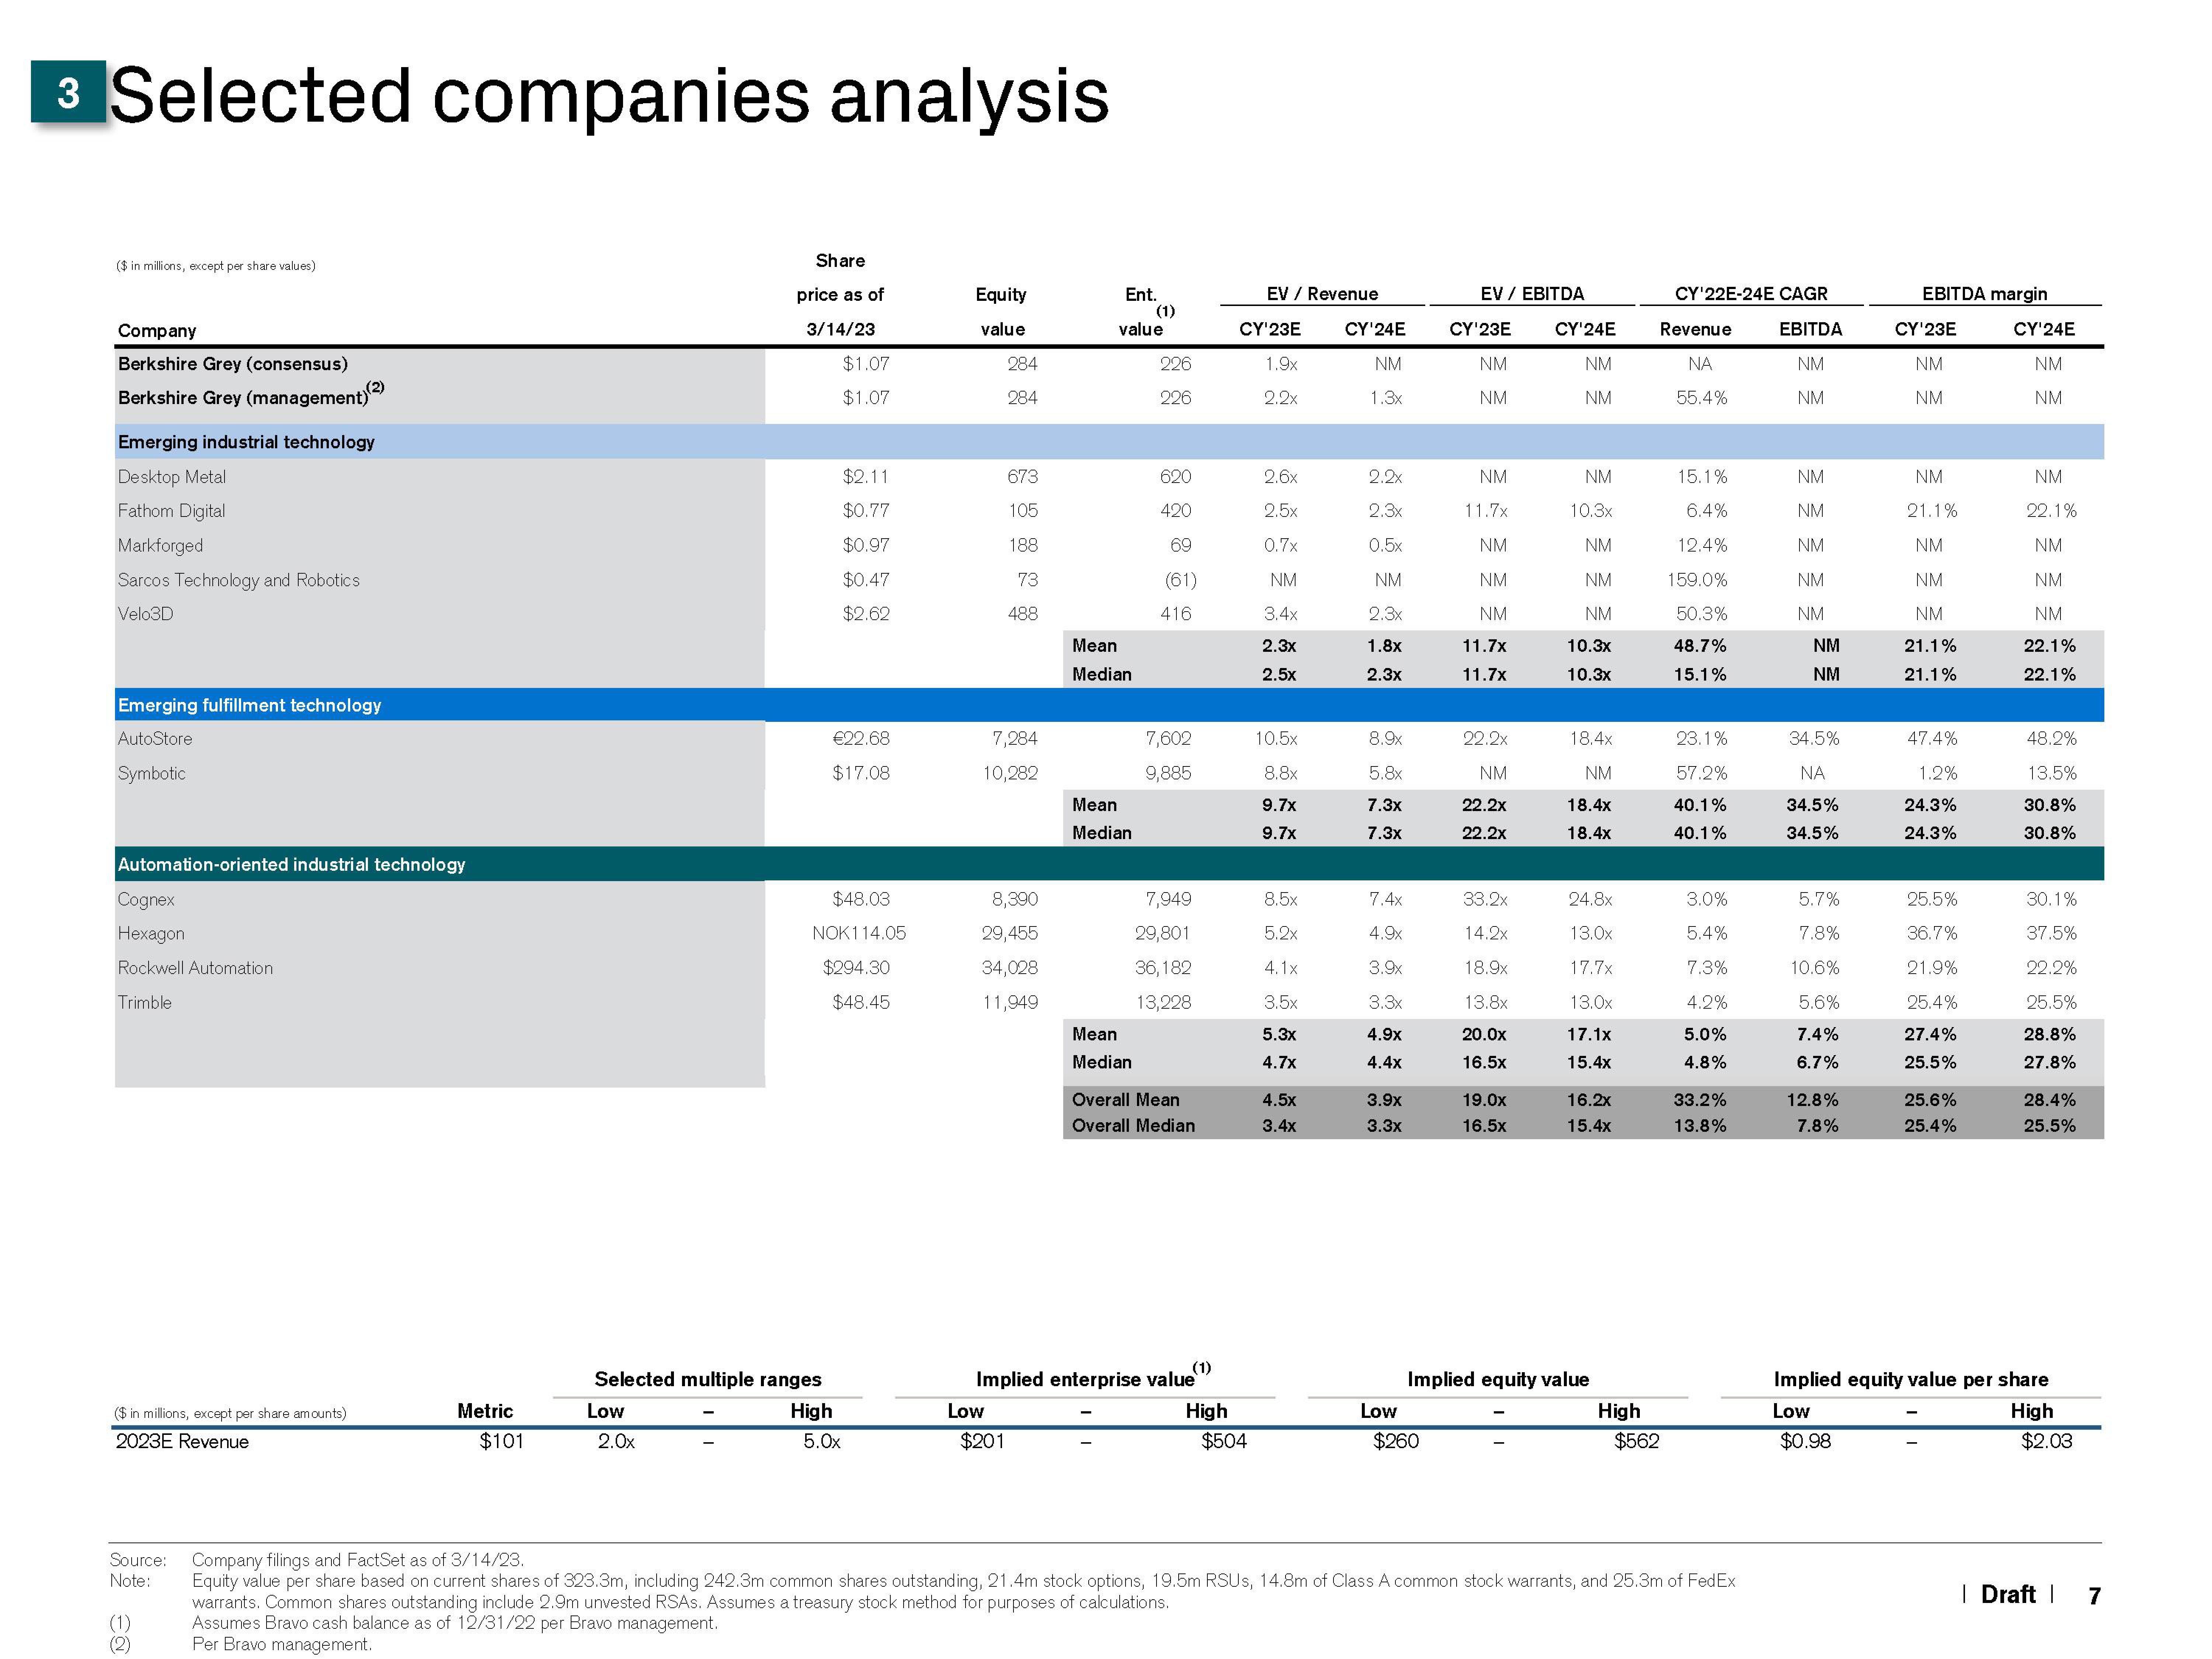
3 Selected companies analysis
($ in millions, except per share values)
Company
Berkshire Grey (consensus)
Berkshire Grey (management) (2)
Emerging industrial technology
Desktop Metal
Fathom gital
Markforged
Sarcos Technology and Robotics
Velo3D
Emerging fulfillment technology
AutoStore
Symbotic
Automation-oriented industrial technology
Cognex
Hexagon
Rockwell Automatic
Trimble
($ in millions, except per share amounts)
2023E Revenue
Metric
(1)
(2)
$101
Low
Share
price as of
3/14/23
2.0x
Selected multiple ranges
High
$1.07
$1.07
$2.11
$0.77
$0.97
$0.47
$2.62
€22.68
$17.08
$48.03
NOK 114.05
$294.30
$48.45
5.0x
Equity
value
284
284
673
105
188
73
488
7,284
10,282
8,390
29,455
34,028
11,949
Low
$201
Ent.
value
Mean
Median
Mean
Median
(1)
Mean
Median
226
226
620
420
69
(61)
416
7,602
9,885
7,949
29,801
36,182
13,228
Overall Mean
Overall Median
(1)
Implied enterprise value
EV / Revenue
CY¹23E
1.9x
2.2x
High
$504
2.6x
2.5x
0.7x
NM
3.4x
2.3x
2.5x
10.5×
8.8x
9.7x
9.7x
8.5x
5,2x
4.1x
3.5x
5.3x
4.7x
4.5x
3.4x
CY'24E
NM
1.3x
2.2x
2.3x
0.5x
NM
2.3x
1.8x
2.3x
8.9x
5.8x
7.3x
7.3x
7.4x
4.9x
3.9x
3.3x
4.9x
4.4x
3.9x
3.3x
Low
EV / EBITDA
$260
CY'23E
NM
NM
NM
11.7x
NM
NM
NM
11.7x
11.7x
22.2x
NM
22.2x
22.2x
33.2x
14,2x
18.9x
13.8x
20.0x
16.5x
19.0x
16.5x
CY'24E
NM
NM
NM
10.3x
NM
NM
NM
10.3x
10.3x
18.4x
NM
18.4x
18.4x
24.8x
13.0x
17.7x
13.0x
17.1x
15.4x
16.2x
15.4x
Implied equity value
High
CY'22E-24E CAGR
EBITDA
NM
NM
Revenue
ΝΑ
55.4%
$562
15.1%
6.4%
12.4%
159.0%
50.3%
48.7%
15.1%
23.1%
57.2%
40.1%
40.1%
3.0%
5.4%
7.3%
4.2%
5.0%
4.8%
33.2%
13.8%
Source: Company filings and FactSet as of 3/14/23.
Note:
Equity value per share based on current shares of 323.3m, including 242.3m common shares outstanding, 21.4m stock options, 19.5m RSUS, 14.8m of Class A common stock warrants, and 25.3m of FedEx
warrants. Common shares outstanding include 2.9m unvested RSAS. Assumes a treasury stock method for purposes of calculations.
Assumes Bravo cash balance as of 12/31/22 per Bravo management.
Per Bravo management.
NM
NM
NM
NM
NM
NM
NM
34.5%
NA
34.5%
34.5%
5.7%
7.8%
10.6%
5.6%
7.4%
6.7%
12.8%
7.8%
EBITDA margin
CY'23E
NM
NM
NM
21.1%
NM
NM
NM
21.1%
21.1%
47.4%
1.2%
24.3%
24.3%
25.5%
36.7%
21.9%
25.4%
27.4%
25.5%
25.6%
25.4%
CY'24E
NM
NM
NM
22.1%
NM
NM
NM
22.1%
22.1%
48.2%
13.5%
30.8%
30.8%
30.1%
37.5%
22.2%
25.5%
28.8%
27.8%
28.4%
25.5%
Implied equity value per share
Low
High
$2.03
$0.98
| Draft |
7View entire presentation