Bank of America Investment Banking Pitch Book
Revenue
Segment Income
Wholesale
Consumer Direct
Royalty Income
Total Revenue
% Growth:
Wholesale
Consumer Direct
Royalty Income
Total Revenue
Wholesale
Consumer Direct
Licensing / International
Segment Income (
% Margin:
Wholesale
Consumer Direct
Segment Income
Less: Other Corporate Expenses
Consolidated Adjusted EBIT
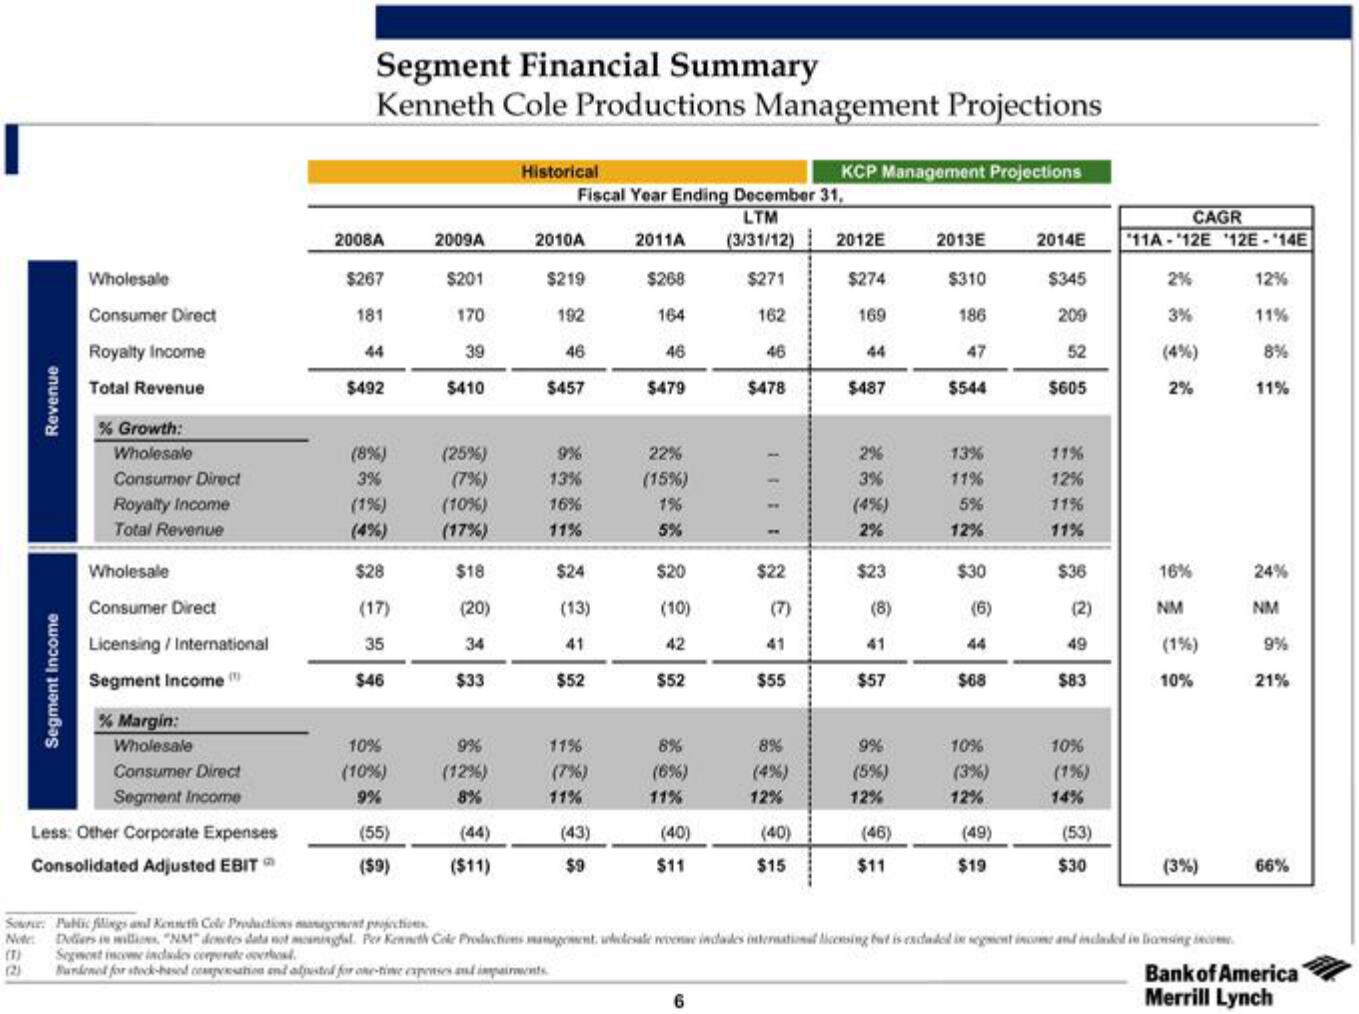
Segment Financial Summary
Kenneth Cole Productions Management Projections
2008A
$267
181
44
$492
(8%)
3%
(1%)
(4%)
$28
(17)
35
$46
10%
(10%)
9%
(55)
($9)
2009A
$201
170
39
$410
(25%)
(7%)
(10 %)
(17%)
$18
(20)
34
$33
9%
(12%)
8%
(44)
($11)
Historical
Fiscal Year Ending December 31,
LTM
2011A (3/31/12) 2012E 2013E
2010A
$219
192
46
$457
9%
13%
16%
11%
$24
(13)
41
$52
11%
(7%)
11%
(43)
$9
$268
164
46
$479
22%
(15%)
1%
5%
$20
(10)
42
$52
8%
(6%)
(40)
$11
$271
162
6
46
$478
$22
(7)
41
$55
8%
12%
KCP Management Projections
(40)
$15
$274
169
44
$487
2%
3%
(4%)
2%
$23
(8)
41
$57
9%
(5%)
12%
(46)
$11
$310
186
47
$544
13%
11%
5%
12%
$30
(6)
44
$68
10%
(3%)
12%
(49)
$19
2014E
$345
209
52
$605
11%
12%
11%
11%
$36
(2)
49
$83
10%
(1%)
14%
(53)
$30
"11A-12E 12E-14E
CAGR
2%
3%
2%
16%
NM
(1%)
10%
(3%)
Source: Pablic filings and Kenneth Cole Productions management projections
Note: Dollars in millions "NM denotes data not meaningfal. Per Kenneth Cole Productions management wholesale recense incades international licensing but is excluded in segmient income and included in licensing incom
(T) Segment income includes corperate overhead.
(2)
Banknot for stock-based compensation and adjusted for one-time expenses and impairments.
12%
11%
8%
11%
24%
NM
9%
21%
66%
Bank of America
Merrill LynchView entire presentation